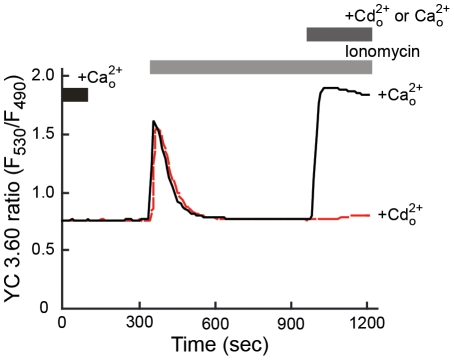
Figure 3. Effect of cadmium on YC3.60 fluorescence in HEK293::YC3.60 cells.
Traces represent changes in YC3.60 fluorescence ratios following ionomycin exposure in calcium-free HBSS. At ∼15 min, the medium was supplemented with either 2 mM calcium ( , black line) or 2 mM cadmium (
 , red line). Traces are representative of typical responses observed in four independent experiments.

