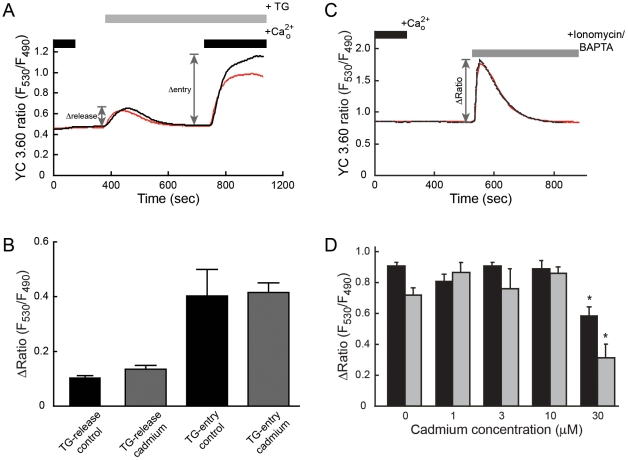
Figure 4. panel A, Traces represent [Ca2+]i measured in control HEK293::YC3.60 cells (black line) or cells following exposure to 1 µM cadmium for 4 hr (red line).
The traces are representative of typical responses observed in at least three independent experiments. panel B, Means of the peak values in thapsigargin response following exposure to 1 µM cadmium for 4 hr (gray bar) or non-cadmium treated (black bar). Data were expressed as the mean ± SEM and were analyzed by an unpaired t-test. There were no significant differences between control and the cadmium exposed groups. panel C, Traces represent [Ca2+]i measured in HEK 293::YC3.60 cells under control conditions (black line) or following a 4 h exposure to 1 µM cadmium (red line). Following incubation with cadmium, cells were treated with an ionomycin-BAPTA solution in calcium-free HBSS. The traces were representative of typical responses observed in at least three independent experiments. panel D, Mean peak values of ionomycin responses in HEK293::YC3.60 cells following exposure to 0, 1, 3, 10, and 30 µM cadmium for 4 h (black bar) or 24 h (gray bar). Data were expressed as the mean ± SEM and were analyzed by one-way ANOVA followed by Dunnett's post-test. Asterisks (*) indicate significant difference (p<0.001) between control and cadmium exposed groups.

