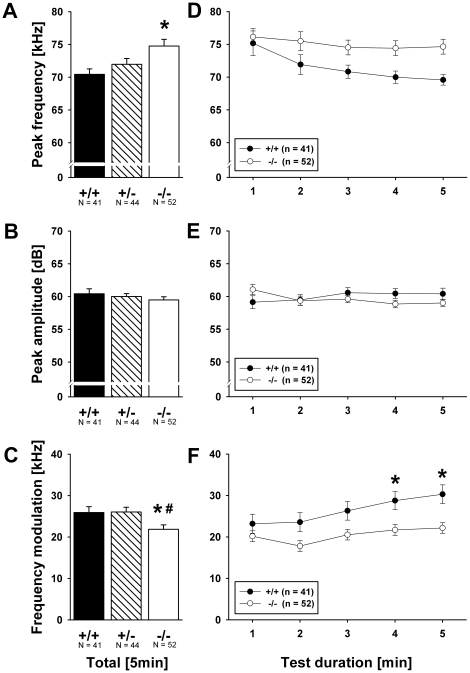
Figure 3. Ultrasonic vocalizations in isolated Shank1 pups.
(A) Peak frequency, (B) peak amplitude and (C) frequency modulation of calls emitted during the 5 min isolation from mother and littermates. (D) Time course for the peak frequency, (E) peak amplitude, and (F) frequency modulation of calls emitted for each 1 min time bin across the 5 min isolation session. Black bar: Shank1+/+ wildtype littermate control mice; striped bar: Shank1+/ − heterozygote mice; white bar: Shank1 −/− null mutant mice. For the sake of clarity, Shank1+/ − heterozygote mice were not included in the time course graphs, while still included in the statistical analysis. Data are presented as means ± standard errors of the mean. * p<0.050 vs. Shank1+/+; # p<0.050 vs. Shank1+/.

