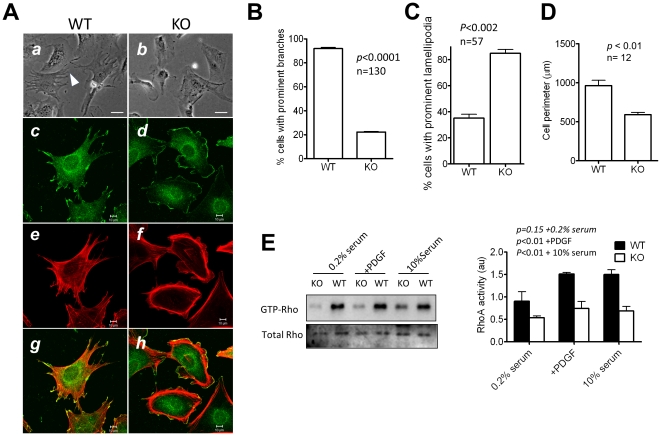
Figure 2. MIM−/− cells display a distinct morphology and altered actin cytoskeleton reorganization.
(A) MIM+/+ (WT) MEFs (a, c, e, and g) and MIM−/− (KO) cells (b, d, f and h) were grown in 10% serum-containing medium on fibronectin covered slips, inspected by phase-contrast view (a and b) or by confocal microscopy following co-staining with cortactin antibody (c and d) and phalloidin (e and f). The images c and e were merged as g, and the images d and f were merged as h. Scale bars: a and b, 50 µm; c–h, 10 µm. (B) Quantification of the percentage of cells bearing prominent body projections as revealed under phase-contrast microscopy. (C) Quantification of the cell surface perimeter measured by MetaMorph program. (D) Quantification of the percentage of cells with prominent cortactin-enriched lamellipodia. (E) Activation of Rho is elevated in MIM−/− cells. Cells were arrested in 0.2% serum-containing medium and stimulated with 30 ng/ml PDGF for 10 min. The level of GTP-Rho was measured by pull-down assay as described in the Materials and Methods. As a control, cells grown in 10% serum were also analyzed in parallel. Quantification of Rho activation is presented on the right based on three experiments (mean ± SEM). All the p values (t-test) refer to the difference between MIM+/+ and MIM−/− cells.

