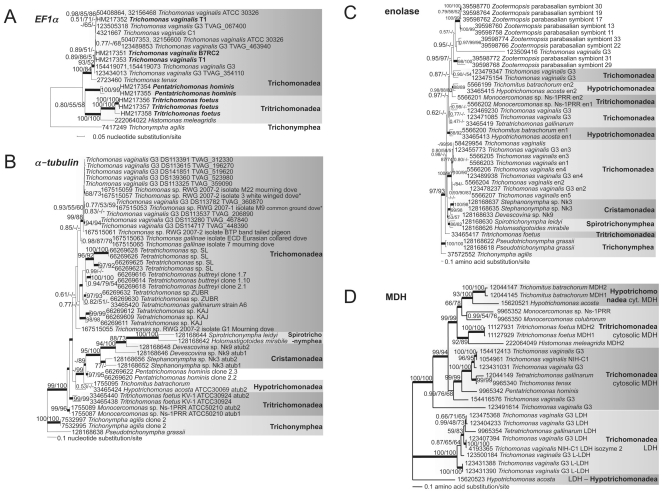
Figure 5. Phylogenetic analyses of parabasalid EF1α, α-tubulin, enolase and MDH exhibit discordant topologies and multiple nonidentical gene copies per taxon.
The consensus tree topologies of the sets of best trees calculated by Bayesian inference are shown. Thickened lines indicate the nodes supported by a Bayesian posterior probability of 1.00. Numbers at the nodes correspond to Bayesian posterior probabilities, followed by percent bootstrap support ≥50% given by PhyML and RAxML (1000 replicates each). The alignments are provided in the Datasets S5 (EF1α), S6 (α-tubulin), S7 (enolase) and S8 (MDH). (A) EF1α. T. foetus, P. hominis and T. vaginalis EF1α sequences determined in this study are indicated in bold. 1230 nucleotides partitioned by codons were analyzed, giving this consensus topology of the 9250 best trees. LnL = −5053.71, α = 2.66 (1.21<α<5.26), pI = 0.043 (0.0015<pI<0.13). Scale bars represent 0.05 nucleotide substitution per site. (B) α-tubulin. This consensus topology of the 8000 best trees was drawn from 1041 aligned nucleotides that were partitioned by codons. LnL = −10690.49, α = 1.27 (1.02<α<1.59), pI = 0.018 (0.00083<pI<0.049). Scale bar represents 0.1 nucleotide substitution per site. *indicate the same Trichomonas sp. from which we also obtained Rpb1 genes. (C) Enolase. Analysis of 331 aligned amino acids gave this consensus topology of the 8250 best trees. LnL = −9781.32, α = 0.84 (0.70<α<1.00), pI = 0.013 (0.00034<pI<0.044). Scale bar represents 0.1 amino acid substitution per site. (D) MDH. 308 amino acids were analyzed, giving this consensus topology of the 9000 best trees. LnL = −6019.55, α = 1.48 (1.07<α<2.07), pI = 0.049 (0.0032<pI<0.11). Scale bar represents 0.1 amino acid substitution per site. GenBank accession numbers are shown at the left for each taxon.

