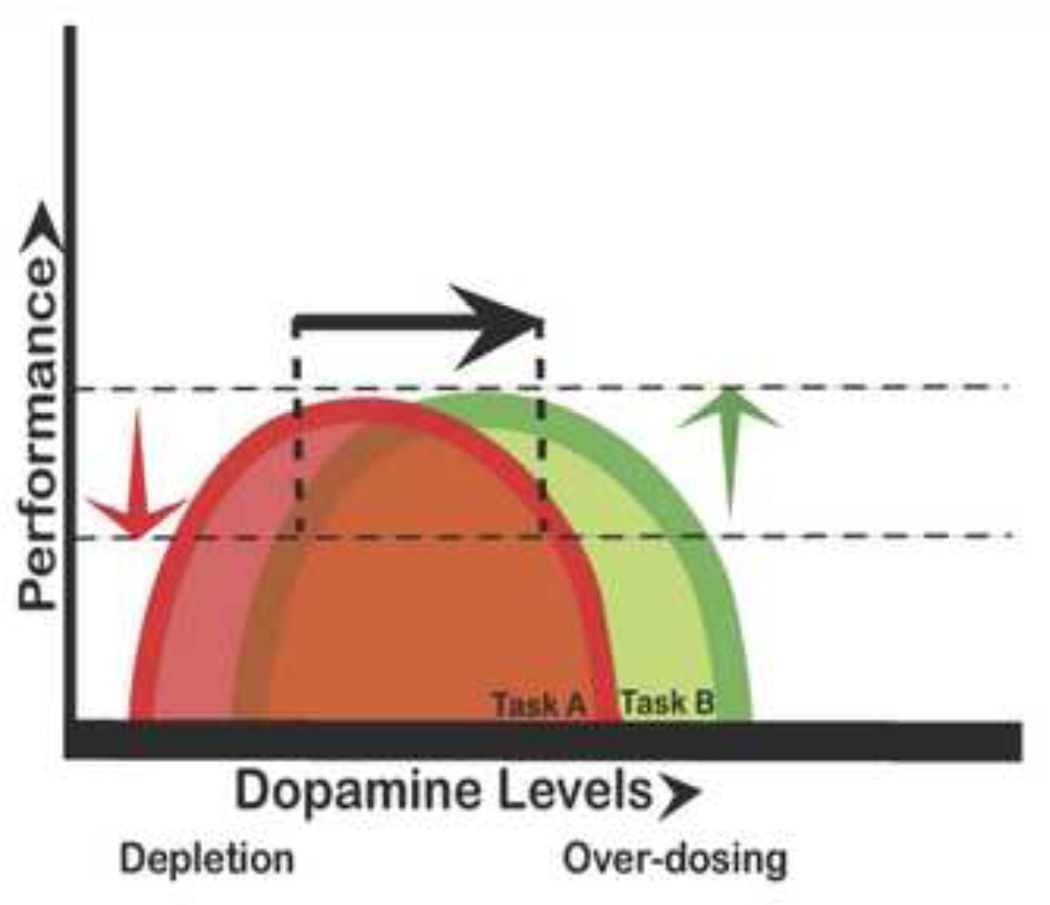
Figure 1.
The relationship between cognitive performance and DA levels follows an ‘Inverted U-shaped’ function, where both too little and too much DA impairs performance. How likely it is that a drug will cause beneficial or detrimental effects depends partly on basal dopamine levels. A single ∩ curve is insufficient to predict performance: Some tasks benefit from increasing dopamine (green), while performance on other tasks is disrupted by increasing dopamine (red). The black arrow represents the dopamine-enhancing effect of a hypothetical drug, leading to a beneficial effect on task A (red), but a detrimental effect on task B (green). Reproduced with permission from Cools and Robbins [13].

