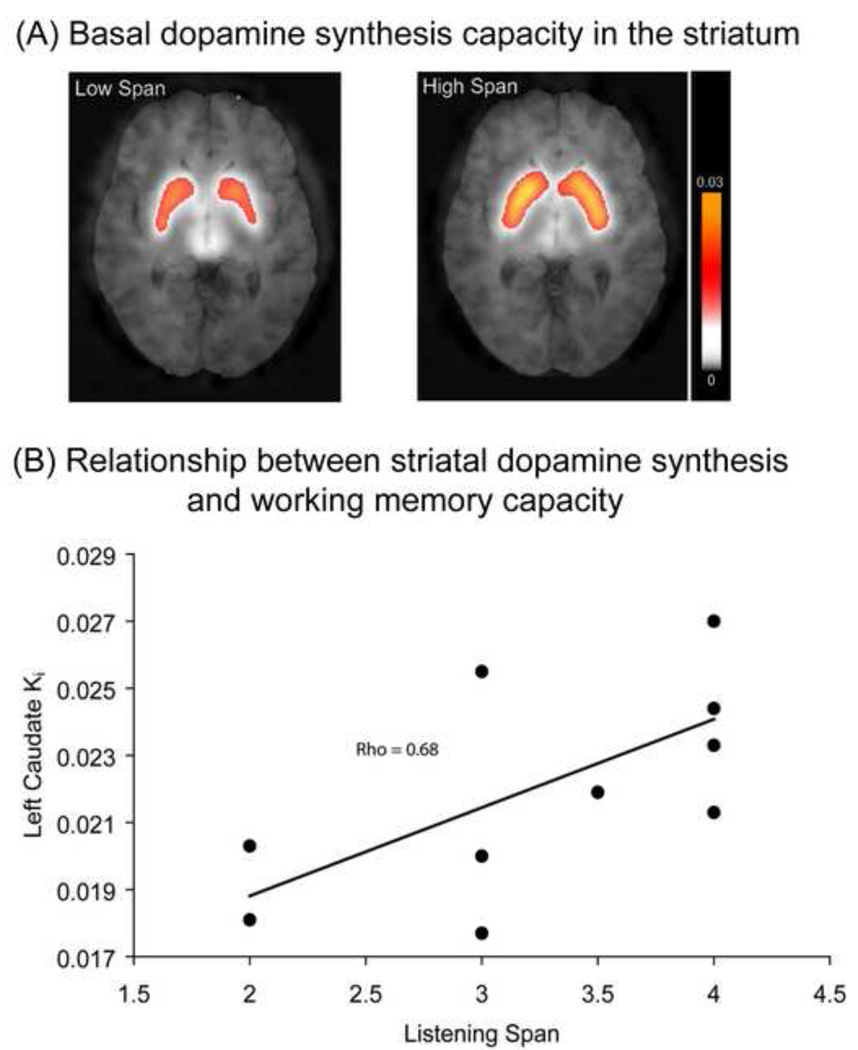
Figure 2.
(a) The mean raw axial (MR co-registered) whole-brain FMT PET Ki images from the high-span group (left panel) and from the low-span group (right panel) overlaid on a normalized MR image. Data represent Ki-values. Right is right according to neurological conventions; (b) Correlation between working memory capacity (on the x-axis: listening span) and dopamine synthesis capacity in the striatum (on the y-axis: Ki values from the left caudate nucleus). Adapted with permission from Figure 1 and 2 from Cools et al [89].

