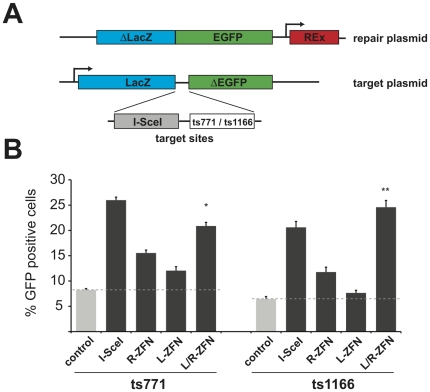
Figure 4. Episomal gene repair assay in HEK293T cells.
(A) Schematic representation of the experimental setup. (B) Cells transfected with repair plasmid, target plasmid and ZFN expression vectors were analyzed after 48 hrs by flow cytometry. The diagram displays the fraction of EGFP-positive cells normalized for transfection efficiency. Statistically significant increases in homologous recombination (HR), compared to non-induced HR control (dashed grey line) are indicated with asterisks (** = p<0.0001 and * = p<0.002).

