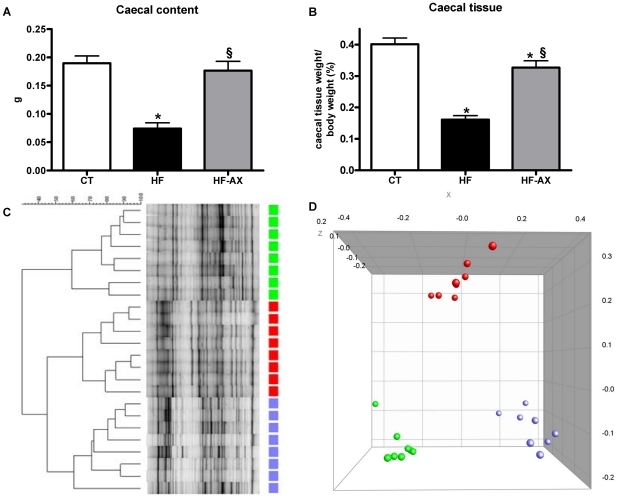
Figure 1. Caecum weight, DGGE fingerprints and PCA analysis in the caecal content.
Caecal content (A) and caecal tissue (B) weight. Denaturing gradient gel electrophoresis (DGGE) fingerprint patterns of the caecal microbial community; the DGGE profiles were constructed using primers for total bacteria (C). Principal Coordinate Analysis (PCA) was used to explore the similarity within a composite data set consisting of DGGE fingerprints of total bacteria, bifidobacteria, lactobacilli and the Bacteroides-Prevotella spp. cluster (D). Mice were fed a standard (CT, green symbols), a high fat diet (HF, red symbols) or a high fat diet supplemented with 10% arabinoxylan (HF-AX, blue symbols) for 4 weeks. *p<0.05 versus CT and §p<0.05 versus HF (ANOVA).

