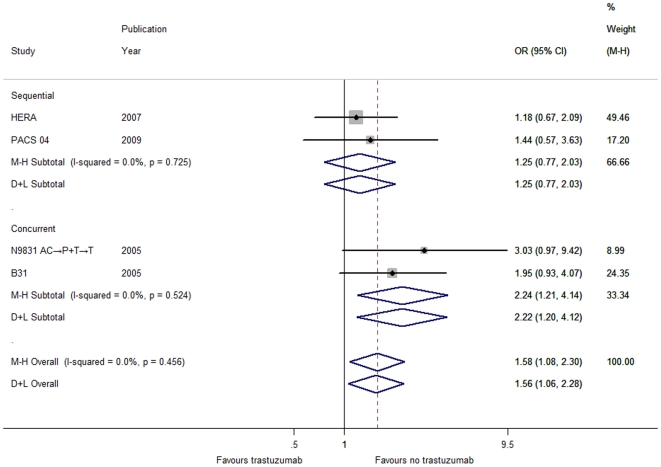
Figure 3. Forest plot of OR for the association between trastuzumab administration and CNS recurrence by the timing of trastuzumab initiation with respect to chemotherapy.
The size of the square box is proportional to the weight that each study contributes in the meta-analysis. The overall estimate and confidence interval are marked by a diamond. Symbols on the right of the solid line indicate OR>1 and symbols on the left of the solid line indicate OR<1. Abbreviations: M-H = Mantel-Haenszel (fixed-effects method); D+L = DerSimonian and Laird (random-effects method).

