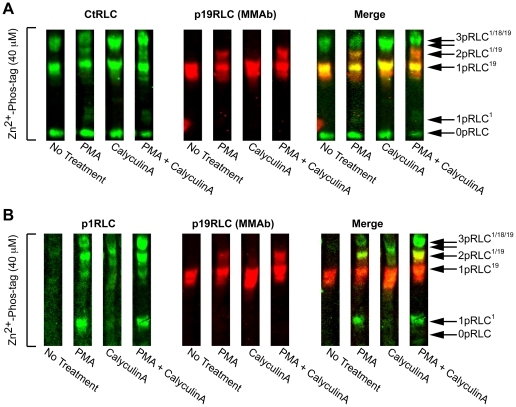
Figure 7. Advanced phos-tag analysis of phosphorylated RLC in PMA-treated uterine myocytes.
A and B. WBs produced by Zn2+-phos-tag (40 µM) separation of lysates from untreated samples, or samples treated with PMA (1 µM), CalyculinA (20 nM), or with both. In both A and B, the red signal corresponds to a mouse monoclonal Ab (MMAb) targeting p19RLC that is detected independently of the green signals (CtRLC in panel A, and p1RLC in panel B). A yellow signal indicates overlap of the individual green and red signals. 0pRLC, 1pRLC, 2pRLC and 3pRLC denote non-, mono-, di-, and tri-phosphorylated RLC. The superscripts denote the position of the phospho-modification: 1: S1, 18: T18, 19: S19. The unlabeled arrow below 3pRLC1/18/19 corresponds to 2pRLC18/19 that is particularly prominent in lysates treated with CalyculinA alone.

