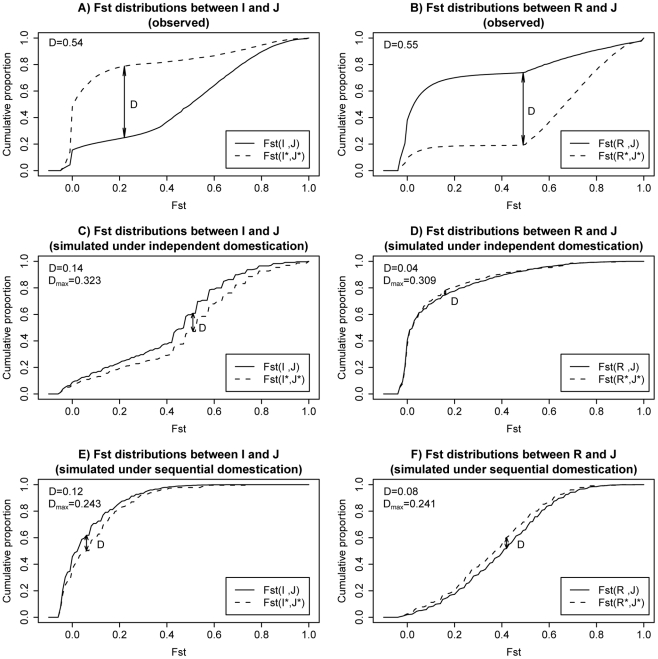
Figure 4. Cumulative plots for Fst distributions in observed data and two example simulations.
A) Observed cumulative plot for Fst between I and J; Fst distribution for overlapping LDRs are plotted in dashed lines. Solid lines are used for genome background. B) Observed cumulative plot for Fst between R and J. C) Simulated cumulative plot for Fst between I and J under an independent domestication history. D) Simulated cumulative plot for Fst between R and J under an independent domestication history. E) Simulated cumulative plot for Fst between I and J under a sequential domestication history. F) Simulated cumulative plot for Fst between R and J under a sequential domestication history. D measures the maximal distances between the two plotted cumulative distributions in each panel (see main text). Both observed D value in real data and maximal value across simulated replicates are shown in left upper corner of each panel.

