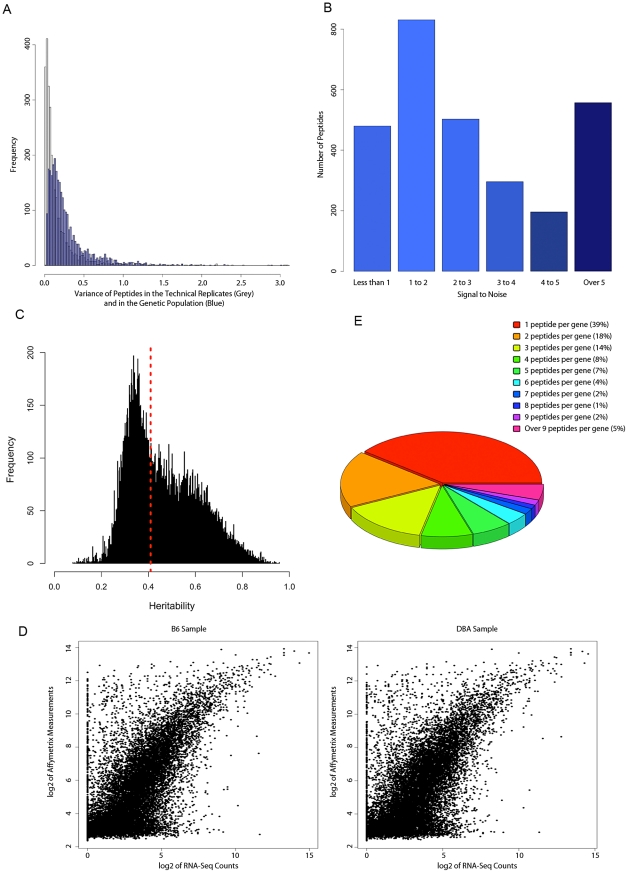
Figure 2. Proteome and transcriptome data quality.
A) Reliability of peptide measurement in LC-MS. The distribution of variance among the technical replicates in the LC-MS data (grey plot) and in the HMDP population (blue plot). B) The frequency of peptides with varying amount as defined by the “signal to noise” ratio. C) Distribution of heritability (fraction of total variance attributed to genetics) in the transcript dataset. The dashed line depicts the significant heritability estimates (p-value<0.05) D) Comparison of Affymetrix data with the Next Generation Sequencing data. E) Number of peptides per gene in the filtered peptide dataset.

