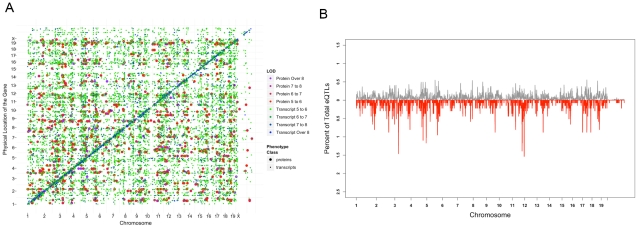
Figure 6. Global analyses of proteome and transcriptome genetic regulation.
A) Global eQTL profile for the 14463 eQTLs and 1368 pQTLs superimposed on each other. In this plot, larger dots represent protein association and smaller dots represent transcript association. The diagonal line with strong association depicts the local eQTLs and pQTLs and each off-diagonal dot depicts the location of distant eQTLs and pQTLs. B) eQTL landscape for protein and transcript data. For each dataset, the genome was divided into 2 Mb bins and the number of eQTLs (grey) and pQTLs (red) were counted separately in each bin as the windows were slid every 50 kb. The frequency of eQTLs and pQTLs in each window are plotted as the fraction of total significant associations (14463 for transcripts and 1368 for proteins).

