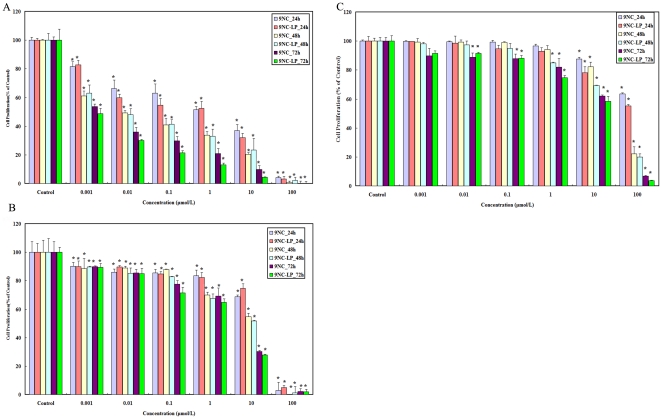
Figure 2. Cell proliferation inhibitory effects of 9NC and 9NC-LP on HepG2, L02 and Hep3B cells in vitro.
Cell proliferation of HepG2(A), L02(B) and Hep3B(C) cells was measured after exposure to compounds for 24–72 h. All assays were done in triplicate. The proliferation index is in comparison with untreated cells (*P<0.01, <$>\raster(60%)="rg1"<$>P<0.05 vs. control) (There no significant differences between cells treated with 4‰DMSO, Liposomes (free) and untreated cells. Data not shown).

