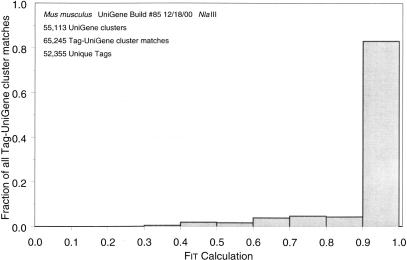
Figure 3.
Distribution of Fit values for all tag-UniGene cluster matches. Fit values were calculated as described in Equation 1 and represent the proportion of tag-UniGene cluster matches that come from the given tag sequence plus the count of all other tag matches in the given UniGene cluster. In our experience, Fit values >0.9 generally result from UniGene clusters with numerous EST sequencing errors and usually are indicative of only one SAGE tag matching a UniGene cluster.

