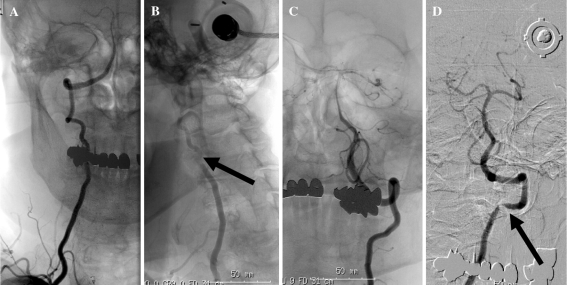
Fig. 1.
Preoperative cerebral angiograms of the right VA show normal flow in the neutral position (a), and severe stenosis between the transverse foramen of C3 and C4 (arrow) and decreased flow on rightward head rotation (b), and angiograms of the left VA show normal flow in the neutral position (c), and severe stenosis at the C1–2 level (arrow) and decreased flow on rightward head rotation (d)

