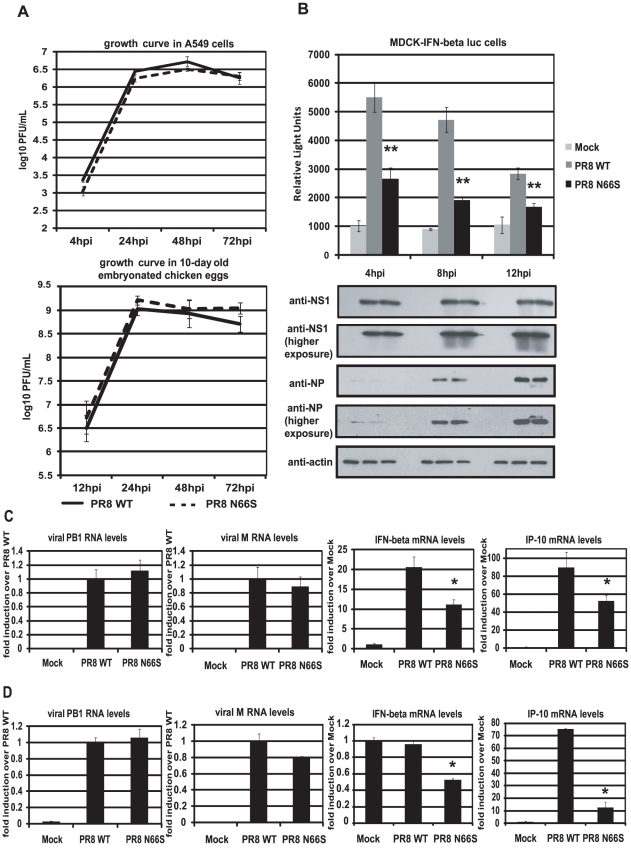
Figure 2. PB1-F2 N66S induces less IFN compared to PB1-F2 WT in the context of viral infection.
(A) Growth curves of PR8 WT and PR8 N66S viruses in A549 cells and in ovo. A549 cells were infected with virus at an MOI of 0.01 and aliquots of the supernatants were taken at 4, 24, 48 and 72 hpi. To determine viral titers, supernatants were plaqued on MDCK cells. Ten-day old embryonated chicken eggs were inoculated with 100 PFU of virus and placed at 4°C at 12, 24, 48 and 72 hpi. The following days, allantoic fluids were harvested, spun down and titered via plaque assays on MDCK cells. (B) An MDCK cell line expressing an IFN-β promoter driven luciferase reporter (MDCK-IFN-beta luc) was infected with PR8 WT and PR8 N66S viruses at an MOI of 2. Cells were lysed at 4, 8 and 12 hpi and luciferase activity was measured. In addition, cell lysates were analyzed for protein expression via Western blots. (C and D) Primary murine dendritic cells (C) or murine lung epithelial cells (D) were infected with the indicated PR8 viruses at an MOI of 2. RNA was isolated 8 hpi and subjected to qRT-PCR. All data represent means ± standard deviations of one representative experiment (n = 3). Statistical significance was determined using Student's t test. *, p<0.05; **, p<0.01. Statistical significance is relative to PR8 WT. All data shown are representatives of at least two independent experiments.

