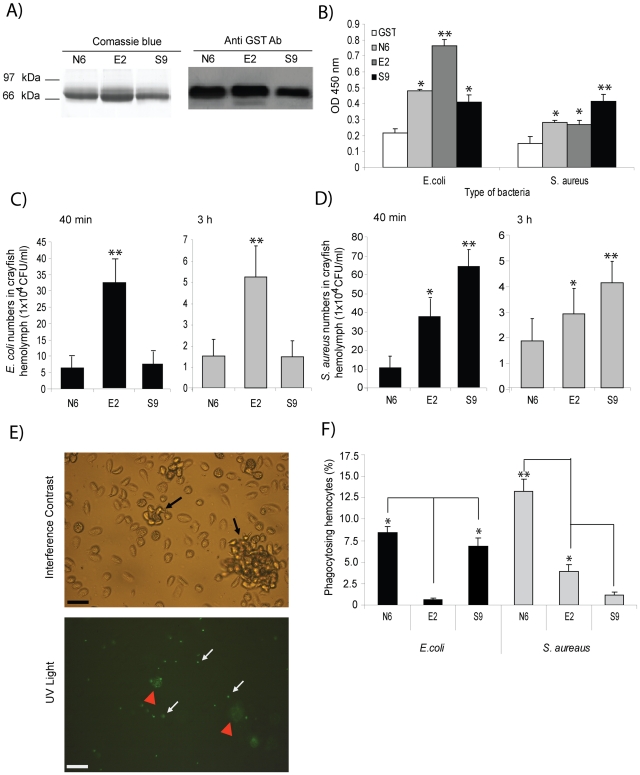
Figure 6. Bacteria-induced PlDscam isoforms have different binding ability to bacteria.
A) Different PlDscam isoforms were amplified from N6, E2 and S9 subclones and recombinant proteins were produced. The recombinant isoforms were subjected to 12% SDS and were confirmed by western blotting. Isoforms from non-injected animals in lanes 1 and 4; E. coli- induced isoform in lanes 2 and 5; and S. aureus-induced isoform in lanes 3 and 6. B) In vitro binding assays of rPlDscam isoforms of E. coli (left) and S. aureus (right), respectively. Binding of bacteria to different rPlDscam isoforms, consisting of N6 = isoforms from non-induced animal, E2 = E. coli induced isoforms, S9 = S. aureus induced isoforms or GST = control recombinant protein was determined using ELISA by measuring the absorbance of samples at 450 nm (OD450). C and D) The effect of bacteria induced isoforms on the clearance process in vivo was tested by pre-incubation of the bacteria E. coli (C) and S. aureus (D) with each recombinant isoform prior to injection into crayfish. The bacterial numbers in crayfish were determined as CFU/ml of crayfish in the hemolymph at 40 min (black) and 3 h (grey) after the bacterial challenge. This experiment was repeated three times and data represent means of these experiments. E) Phagocytosis and nodule formation of FITC-conjugated heat-killed bacteria by crayfish hemocytes. Black arrows show nodule formation under normal light microscopy. White arrows show the ingested FITC-conjugated heat-killed bacteria by crayfish hemocytes under UV light microscope. Red arrows show nodules that contain several ingested bacterial particles under UV light microscope. F) The percentage of crayfish hemocytes ingesting FITC-conjugated heat-killed E. coli (left) and S. aureus (right) that had been pre-incubated with each isoform of the recombinant proteins and the phagocytic hemocytes was determined at 1.5 h after challenge. Significant difference compared to control is marked by * = P<0.05 and ** = P<0.01.

