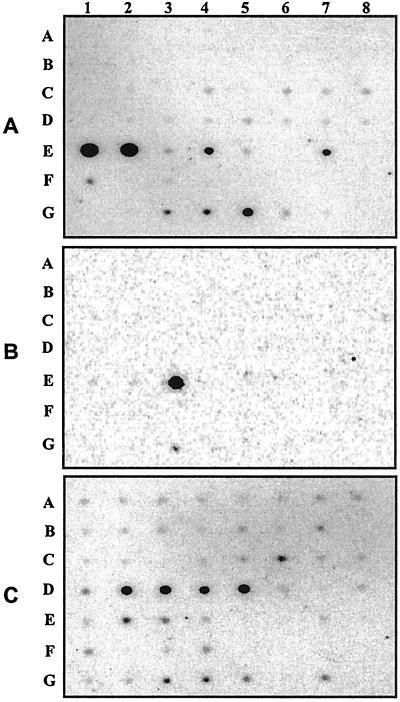
Figure 4.
Dot blot hybridization analysis of the CRBP III (A), CRBP II (B), and I (C) mRNAs in 50 different human tissues (see Materials and Methods for details). Each dot, identified by a letter (from A to G) and a number (from 1 to 8), corresponds to a distinct tissue. The identity of each tissue is specified in Fig. 5.

