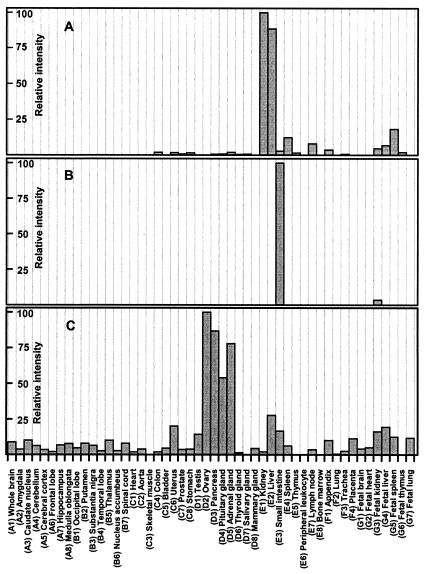
Figure 5.
Distribution of the CRBP III (A), II (B), and I (C) mRNAs in 50 different human tissues. The results are presented as hybridization intensities, derived from the dot blot experiments reported in Fig. 4, relative to the maximum hybridization intensity measured for each CRBP mRNA with each CRBP probe.

