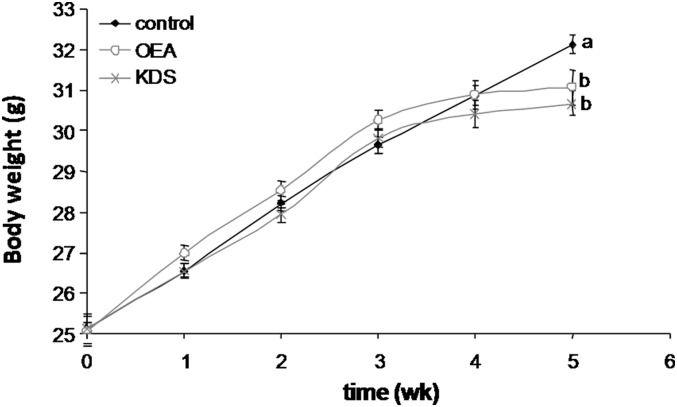
Fig. 2.
Body weight changes are shown. Results are means ± SEM (N = 10 mice per group). Plots not sharing the same letter (a, b) are statistically different (P ≤ 0.05). The bold line with black squares corresponds to the control group; the continuous gray line with open circles corresponds to the 0.1 g/kg BW OEA group; and the gray line with x's corresponds to the 0.1 g/kg BW KDS-5104 group.

