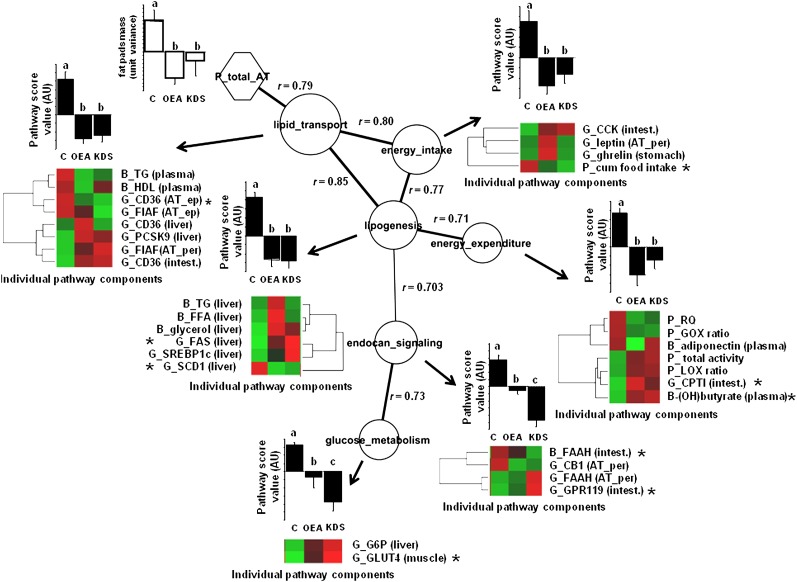
Fig.6.
Correlation network among processes with activity modified by both OEA and KDS-5104 treatments is shown. Each node depicts individual biological activity. Histograms represent means ± SEM of semiquantitative activity of biological functions according to treatments, based on the hierarchical PLS computation performed from the individual components, with letters a, b, and c the ANOVA significance threshold (P < 0.05). Node size represents the importance of the process to predict adipose tissue mass (based on VIP values of the PLS analysis). The edges represent the absolute Pearson coefficient ρ values among the nodes. Edge thickness represents the strength of the correlation among connected nodes. The correlation network was built on the maximum stringency calculated from the minimum structure displaying all nodes. The significance of the Pearson correlation coefficient was checked by false discovery rate with a q value of <0.05. This threshold corresponded to Pearson correlation ρ values of >0.701. By convention, pathway score values of the control mice were always positive, thus emphasizing the contrasting effect of treatments. Individual pathway components are displayed as a heat map sorted according to hierarchical clustering (red box, relative increase; green box, relative decrease [see supplementary material for significant levels across treatments). The asterisk indicates which individual components in the biological module weighs more in the biological score process and is more likely to predict adipose tissue fat pads mass (greatest VIP index of the PLS analysis). Adipose tissue mass is shown as means ± SEM of unit of variance. AT, adipose tissue; G, gene; B, biochemical; P, physiological; ep, epididymal; per, peritoneal; intest., upper intestine; muscle, gastrocnemius muscle; ES, endocannabinoid signaling; GM, glucose metabolism; LT, lipid transport; EI, energy intake; LG, lipogenesis.

