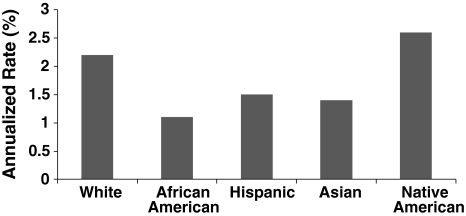
Fig. 2.
A graph shows annualized rates of fracture by race/ethnicity according to the Women’s Health Initiative Observational Study [8]. The annualized rates are greater than 2% for white and Native American women and lower for African American, Hispanic, and Asian women. Reproduced with permission and copyright 2007 of John Wiley & Sons, Inc, from Cauley JA, Wu L, Wampler NS, Barnhart JM, Allison M, Chen Z, Jackson R, Robbins J. Clinical risk factors for fractures in multi-ethnic women: The Women’s Health Initiative. J Bone Miner Res. 2007;22:1816–1826.

