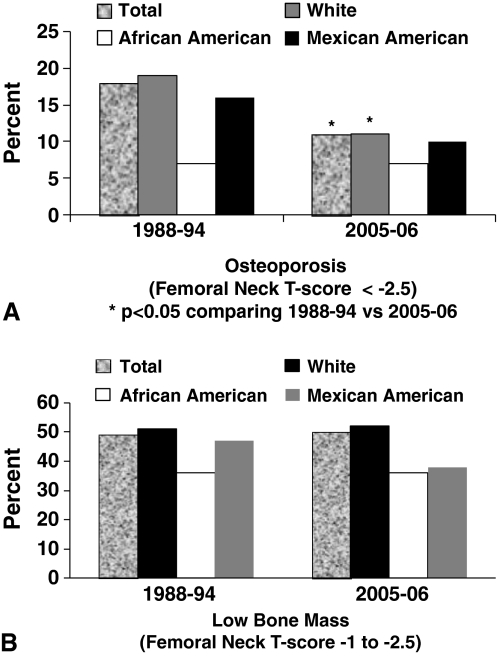
Fig. 4A–B.
(A) The graph shows the prevalence of osteoporosis in NHANES III (1988–1994) and NHANES (2005–2006) for women regarding femoral neck BMD. The overall prevalence of osteoporosis by BMD was about 18% in white women from 1988 to 1994 and declined to about 10% from 2005 to 2006. (B) The graph shows the prevalence of low BMD in NHANES III (1988–1994) and NHANES (2005–2006) for women regarding femoral neck BMD [24]. The prevalence of low bone mass (T score of −1 to < −2.5) did not change over time. Reproduced with permission and copyright 2010 of John Wiley & Sons, Inc, from Looker AC, Melton LJ 3rd, Harris TB, Borrud LG, Shepherd JA. Prevalence and trends in low femur bone density among older US adults: NHANES 2005–2006 compared with NHANES III. J Bone Miner Res. 2010;25:64–71.

