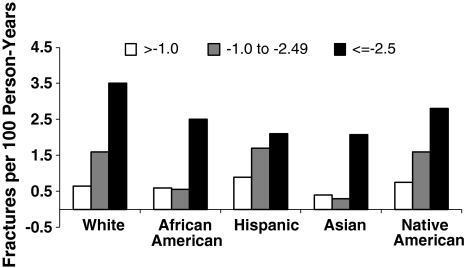
Fig. 6.
A graph shows fracture rates per 100 person-years by ethnicity and T-score according to the National Osteoporosis Risk Assessment Study [1]. Across all ethnicities, low BMD is a consistent risk factor for fractures. Reproduced with permission and copyright 2005 of John Wiley & Sons, Inc, from Barrett-Connor E, Siris ES, Wehren LE, Miller PD, Abbott TA, Berger ML, Santora AC, Sherwood LM. Osteoporosis and fracture risk in women of different ethnic groups. J Bone Miner Res. 2005;20:185–194.

