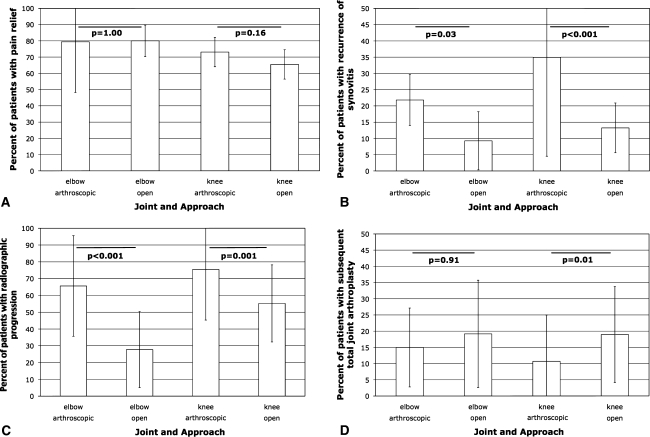
Fig. 2A–D.
The graphs show the weighted mean results at last followup segregated by joint and approach, with weighted standard deviation error bars. The lines connecting the bars show the results of chi square tests. They show (A) percent of patients with pain reduction as compared with preoperatively, (B) percent of patients with recurrence of synovitis, (C) percent of patients with radiographic progression, and (D) percent of patients who subsequently underwent TJA or arthrodesis.

