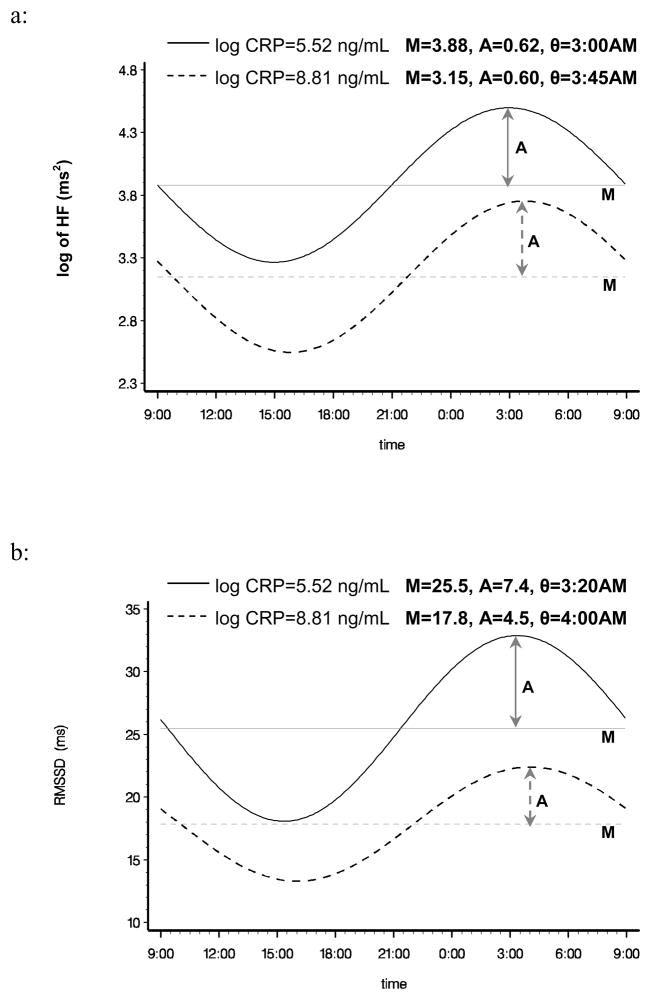
Figure 1.
Multivariable adjusted periodic regression curves of log HF and RMSSD at different values of CRP concentration (approximately the 10th and 90th percentiles).
Curves: The estimated diurnal circadian periodic curves over the time of HRV collection.
Horizontal lines: Mean of periodic curve.
Lines with arrows: Amplitude of periodic curve.

