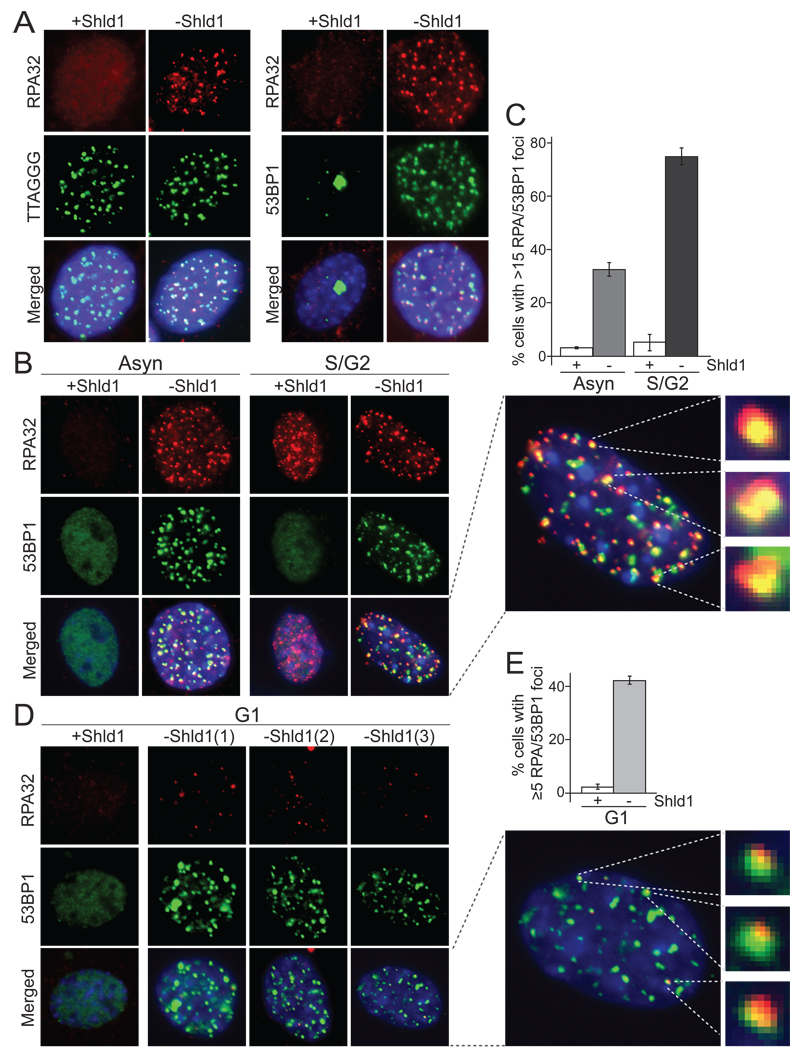
Figure 5. RPA at dysfunctional telomeres upon DD-POT1a depletion.
(A) Formation of RPA foci at 6 hrs after Shld1 withdrawal from c223 cells. Left panels, RPA32 IF (red) and FISH for telomeric TTAGGG repeats (green). Right panels, IF for RPA32 (red) and 53BP1 (green). The merged images include DAPI staining of DNA (blue). (B) IF for RPA (red) and 53BP1 (green) in asynchronous and S/G2 cells after Shld1 withdrawal. An enlarged nucleus is shown on the right together with three randomly selected 53BP1/RPA foci. (C) Quantification of the % of cells containing RPA/53BP1 foci as shown in B. (D) IF for RPA32 (red) and 53BP1 (green) in G1 cells after Shld1 withdrawal. Cells were collected as described in Figure 3. Three independent images of G1 cells after Shld1 withdrawal are shown. An enlarged nucleus is shown on the right together with three 53BP1 foci that also contain RPA. The enlarged images in B and D were processed identically so that the relative intensities of 53BP1 and RPA in the foci can be compared. (E) Quantification the fraction of G1 cells with 53BP1 foci that contain RPA as detected as in D.Cells with 5 or more foci were scored positive. The bargraphs represents the average from three independent experiment and the standard deviations. See Suppl. Fig. 4 for related data.

