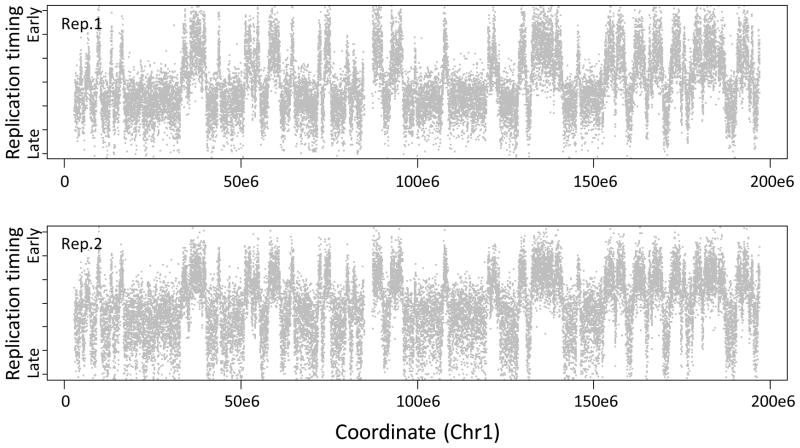
Figure 6.
Replication timing values across chromosome 1. For each replicate, individual log2(Cy5/Cy3) probe intensities are plotted in grey (y-axis) against their position on chromosome 1 (x-axis). Due to photobleaching of Cy5 diagnosed in step 75, timing is skewed toward early values in replicate 1 (top) and late values in replicate 2 (bottom), demonstrating the practical advantages of dye-swap replicates.

