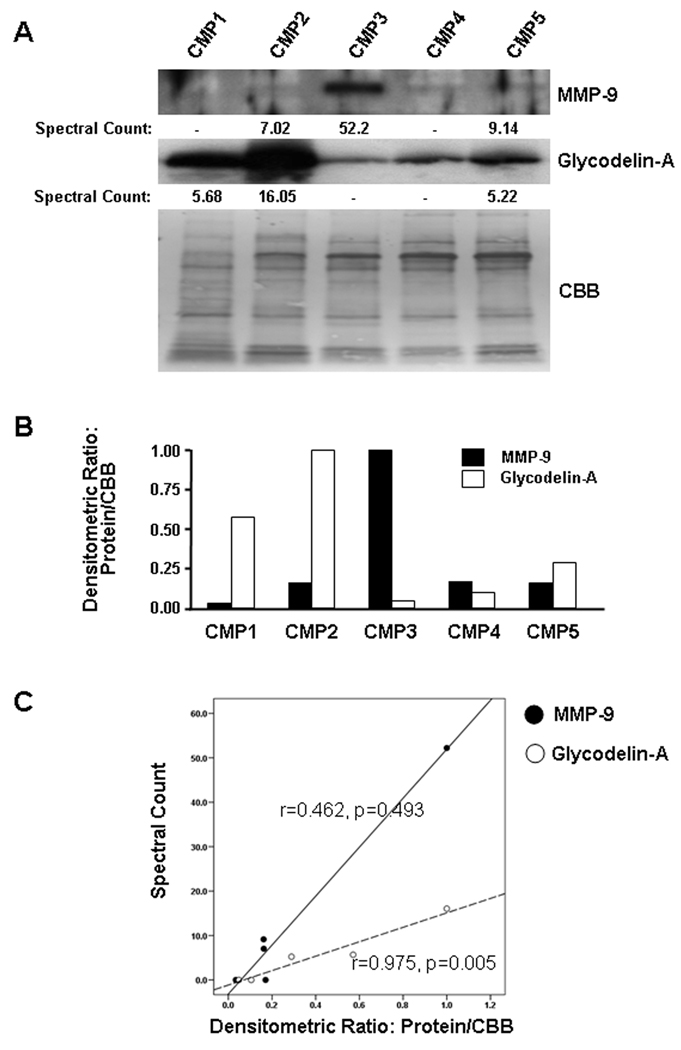
Figure 3.
Validation of LC-MS/MS data by immunoblotting. (A) Immunoblotting using specific antibodies to show abundance of MMP-9 and glycodelin-A (progestagen-associated endometrial protein) in each CMP sample. Spectral counts of MMP-9 and glycodelin-A on LC-MS/MS analysis of each sample were also provided. Spectral counts, obtained from LC-MS/MS analysis, were calculated by normalizing the number of assigned spectra for each protein to the total number of assigned spectra for each LC-MS/MS run. CBB: Coomassie Brilliant Blue (B) Densitometric analysis of MMP-9 and glycodelin-A abundance in each CMP. As there is no housekeeping gene product, which can be used as a loading control for CMP samples, the density of all Coomassie Brilliant Blue stained bands on electro-blotted PVDF membrane were used as a normalizer for densitometric comparison of each sample for MMP-9 and glycodelin-A. (C) There is a good correlation between spectral counts and densitometric values for glycodelin-A (r=0.975, p=0.005) but not for MMP-9 (r=0.462, p=0.493).

