Figure 3.

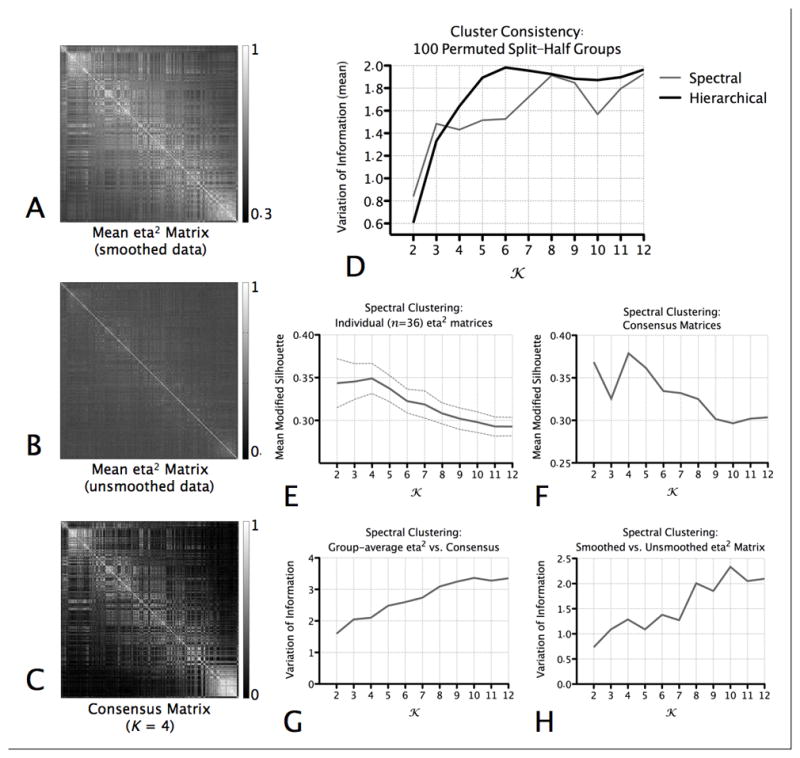
Clustering Indices. (A) The group-average (mean) of the individual eta2 matrices computed on the basis of the smoothed resting state data. (B) The group-average of the individual eta2 matrices computed on the basis of the unsmoothed resting state data. (C) The consensus matrix for K=4. This matrix represents, when K=4, the stability with which pairs of voxels were assigned to the same cluster across individuals. (D) For each value of K, we assessed the similarity of the cluster solutions generated for Group 1 (n = 18) and Group 2 (n = 18) in the permuted-groups split-half comparison procedure using the Variation of Information (VI) metric (Meila, 2007). The graph plots the mean VI across 100 permuted groups, for each K, for the hierarchical and spectral clustering algorithms. Lower VI scores indicate better similarity (consistency) between the solutions computed for each group. (E) Mean (and standard deviation) of the modified silhouette for each value of K, for cluster solutions produced when the spectral clustering algorithm was applied to each individual’s eta2 matrix. (F) Modified silhouette values computed for clustering solutions computed on the basis of the consensus matrices, for each value of K. (G) Similarity between the cluster assignments for the group-average (mean) of the individual eta2 matrices (i.e., shown in A) and those for the consensus matrices (example shown in C). (H) Similarity between the cluster assignments for the group-average (mean) of the individual eta2 matrices computed on the basis of the smoothed resting state data (i.e., shown in A) and the those computed on the basis of the unsmoothed resting state data (example shown in B).
