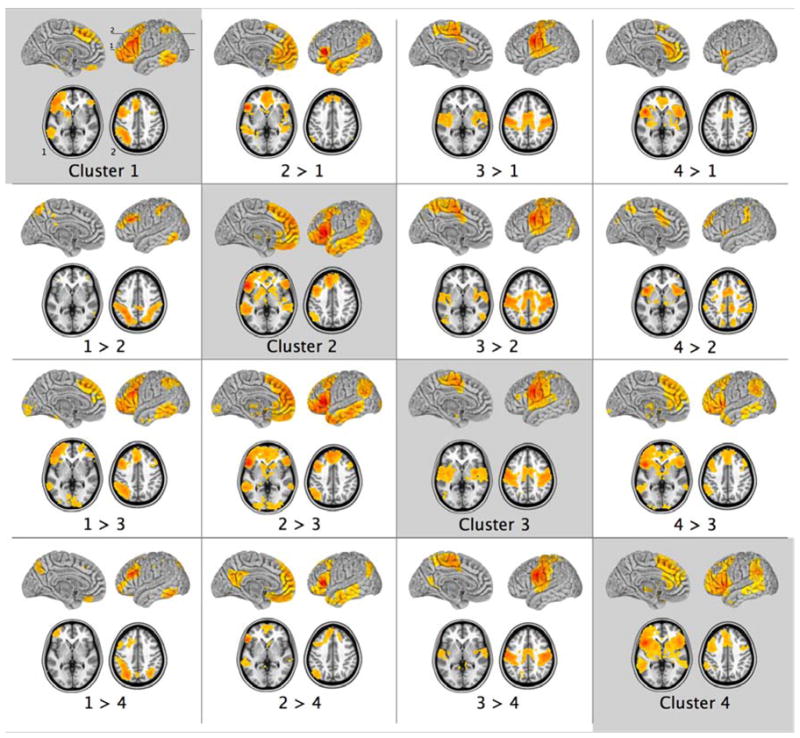
Figure 5.

Patterns of group-level resting state functional connectivity and the results of direct contrasts for the four seed ROIs located at the centers-of-mass of the group-average K = 4 spectral clustering solution. The clusters are marked in Figure 4 and correspond to: the superior part of the inferior frontal gyrus (IFG), bordering the inferior frontal sulcus (Cluster 1); the lateral pars opercularis and pars triangularis (Cluster 2); inferior precentral cortex (Cluster 3); and a fourth region extending medially within the Sylvian fissure from the inferior-most tip of ventral premotor cortex and the pars opercularis towards the anterior insula (Cluster 4). Z > 2.3; cluster significance p < 0.05, corrected. Images are in MNI152 space and are shown according to neurological convention (right is right). The numbers (top left panel) indicate the positions of the axial slices shown in the lower portion of each panel.
