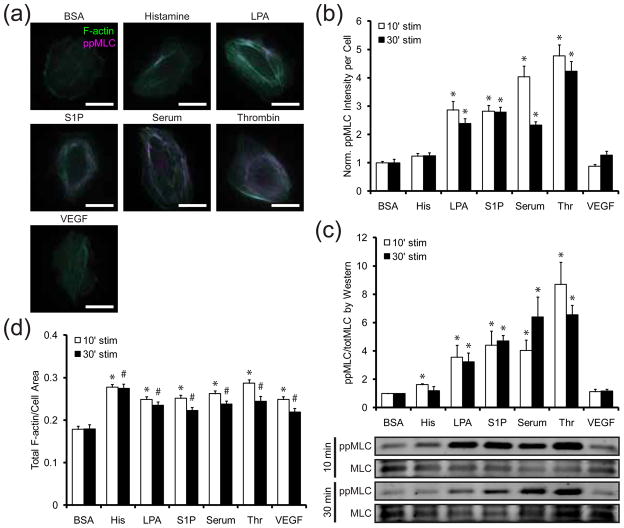
Figure 1. Effects of vasoactive agonists on actin organization and myosin activity.
(a) Representative images of cells stimulated with BSA (10 μg/mL), histamine (3 μM), LPA (10 μg/mL), S1P (0.5 μM), serum (20% v/v FBS), thrombin (1 U/mL), or VEGF (50 ng/mL) for 10 min. F-actin (green) and ppMLC (magenta) are labeled. Scale bars are 25 μm. (b) Fold change in ppMLC immunofluorescence in cells stimulated with BSA (10 μg/mL), histamine (His; 3 μM), LPA (10 μg/mL), S1P (0.5 μM), serum (20% v/v FBS), thrombin (Thr; 1 U/mL), or VEGF (50 ng/mL) for 10 (white bars) and 30 (black bars) min. ppMLC is normalized to the BSA treatment condition for each stimulation duration. Data for each treatment condition is the average of n = 20 cells from one experiment. Error bars indicate SEM. * p < 0.001 indicates comparison against BSA control for the respective stimulation duration. (c) Fold change in ppMLC immunoblot intensity in cells stimulated with the same treatment conditions in (b) for 10 (white bars) and 30 (black bars) min. ppMLC is first normalized against total MLC expression and then normalized to the BSA treatment condition. Data is the average of three independent experiments. Error bars indicate SEM. * p < 0.1 indicates comparison against BSA control for the respective stimulation duration. (d) Fractional coverage of F-actin in cells stimulated with the same treatment conditions in (b) for 10 (white bars) and 30 (black bars) min. Data for each treatment condition is the average of n = 20 cells from one experiment. Error bars indicate SEM. * p ≪ 0.001 indicates comparison against BSA control for 10 min stimulation. # p < 0.01 indicates comparison against BSA control for 30 min stimulation.

