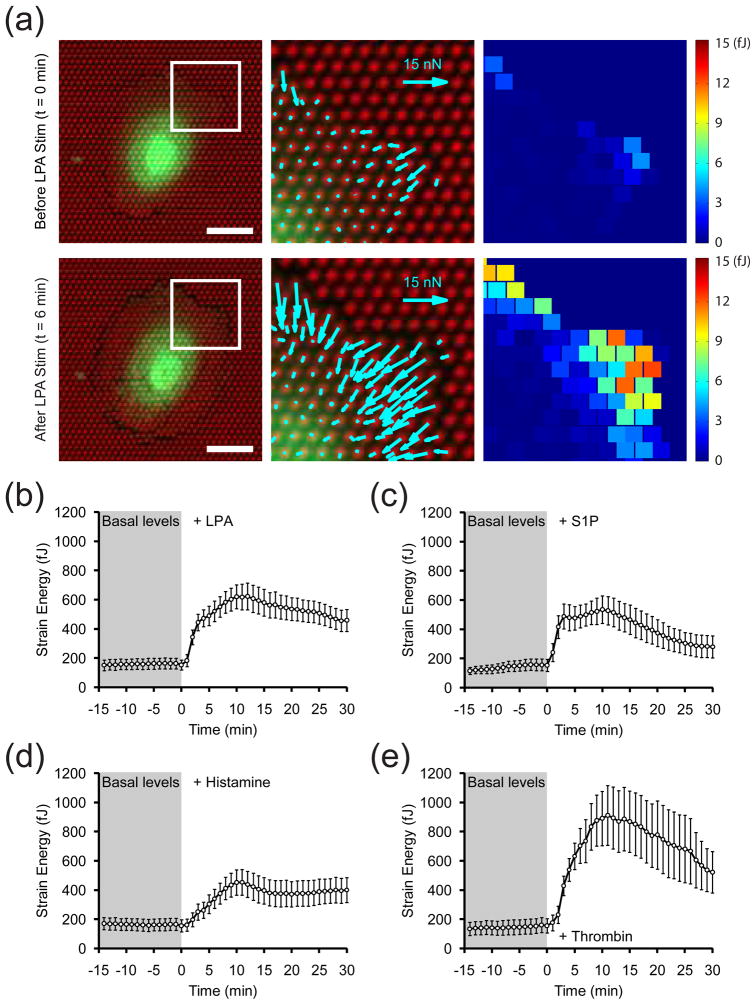
Figure 2. Effects of vasoactive agonists on contractility.
(a) Traction force and strain energy maps of a representative cell before (top row) and after (bottom row) stimulation with LPA (10 μg/mL). The insets in the left panels are magnified in the middle and right panels, which show the traction force vectors and strain energy magnitudes, respectively. Scale bars are 30 μm. (b–e) Time-series plots of the average strain energy of cells stimulated with (b) LPA (10 μg/mL), (c) S1P (0.5 μM), (d) histamine (3 μM) or (e) thrombin (10 nM) immediately after t = 0 min. Data for each treatment condition is the average of n = 17 (LPA), n = 16 (S1P), n = 16 (histamine), and n = 11 (thrombin) cells from one experiment each. Error bars are ± SEM.

