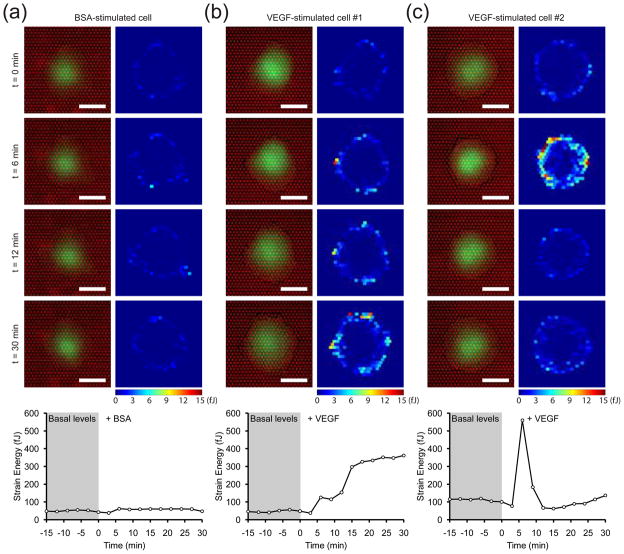
Figure 4. Single-cell heterogeneity in the VEGF-induced contractile response.
(a–c) Time-series images of three representative GFP-expressing cells on mPADs, stimulated with BSA (10 μg/mL) or VEGF (50 ng/mL) immediately after t = 0 min. The corresponding colorimetric map of the strain energy on each micropost is shown next to each image of the cell. The time-series plot of total strain energy for each representative cell is shown below the respective images. Scale bars are 30 μm.

