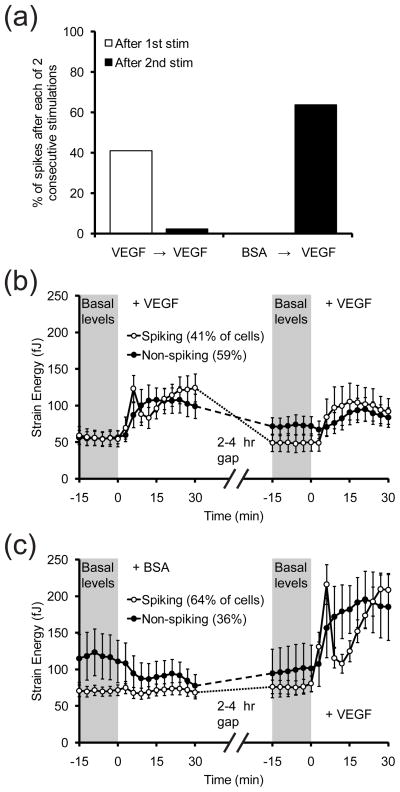
Figure 8. Effects of repeated stimulations of VEGF on contractility.
(a) Bar graph showing the percentage of cells that spike after two stimulations. VEGF (50 ng/mL) or BSA (10 μg/mL) is administered first, and after 2–4 hours, VEGF (50 ng/mL) is added again. Cells were starved in EBM-2 before and in-between stimulations. (b) Time-series plot of the average strain energy of cells that have been stimulated with VEGF twice as described in (a). Strain energy is measured over two 45-minute observation periods for the first and second stimulations, which are added immediately after t = 0 min. Cells were grouped based on whether they spiked (white circles) or did not spike (black circles) after the first stimulation. n = 44 cells pooled from two experiments. Error bars are ± SEM. (c) Time-series plot of the average strain energy of cells that have been stimulated with BSA followed by VEGF as described in (a). Cells were starved in EBM-2 before and in-between stimulations. Strain energy is measured over two 45-minute observation periods for the first and second stimulations, which are added immediately after t = 0 min. Cells were grouped based on whether they spiked (white circles) or did not spike (black circles) after the second stimulation. n = 44 cells pooled from two experiments. Error bars are ± SEM.

