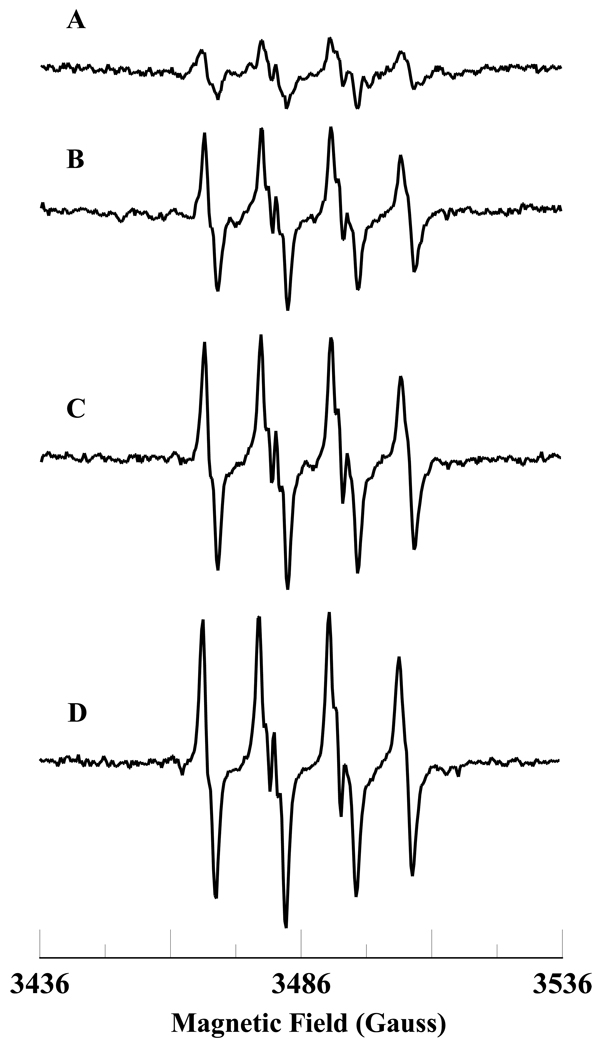
Figure 2.
Room temperature EPR spectra of the superoxide radical adduct of DMPO, DMPO-OOH. All the reactions were performed in 50 mM phosphate buffer (pH = 7.4) containing 0.1 mM DTPA. Spectrum A: DMPO (50 mM), methyl-β-cyclodextrin (0.1 M), Fe3+cyt c (0.1 mM), NADH (0.1 mM), and H2O2 (0.5 mM). Spectrum B: DMPO (50 mM), methyl-β-cyclodextrin (0.1 M), Fe3+cyt c (0.1 mM), NADH (0.5 mM), and H2O2 (0.5 mM). Spectrum C: DMPO (50 mM), methyl-β-cyclodextrin (0.1 M), Fe3+cyt c (0.1 mM), NADH (1 mM), and H2O2 (0.5 mM). Spectrum D: DMPO (50 mM), methyl-β-cyclodextrin (0.1 M), Fe3+cyt c (0.1 mM), NADH (2 mM), and H2O2 (0.5 mM). EPR instrument parameters used were as described in the materials and methods section.

