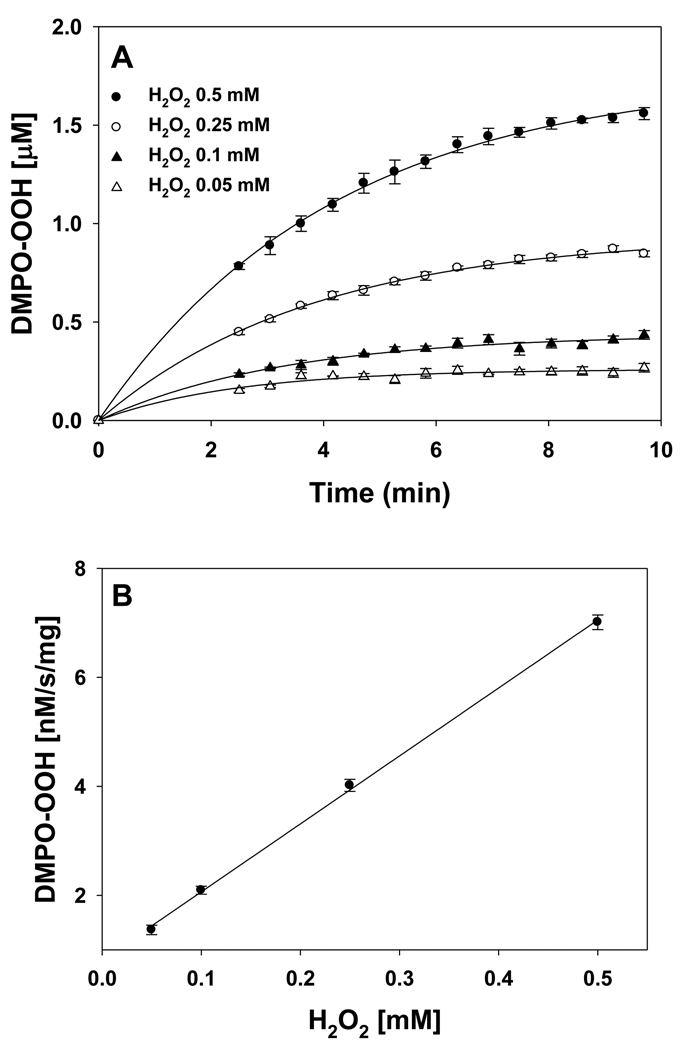
Figure 5.
(A) Plot of the concentration of superoxide radical adduct of DMPO (DMPO-OOH) vs time for various concentrations of H2O2. Experiments were performed with DMPO (50 mM), methyl-β-cyclodextrin (0.1 M), Fe3+cyt c (0.1 mM), NADH (1 mM), and various concentrations of H2O2 in phosphate buffer containing DTPA (0.1 mM). (B) Plot of initial rate of formation of superoxide radical adducts of DMPO (DMPO-OOH) vs H2O2 concentrations. Rates in panel B were obtained from the initial slope of the data from panel A. EPR spectra were quantified by computer simulation of the spectra and comparison of the double integral of the observed signal with that of a TEMPO standard (1 µM) measured under the identical conditions. Data represent means ± S.E (n = 3).

