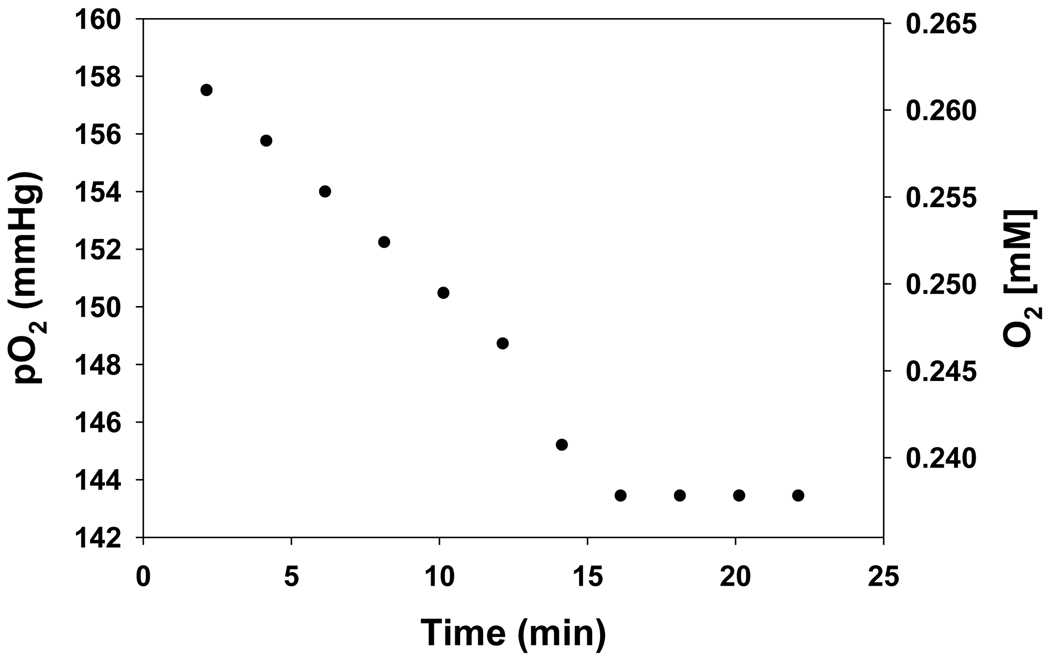
Figure 7.
Plot of the oxygen consumption in phosphate buffer containing Fe3+cyt c (0.1 mM), NADH (1 mM), and H2O2 (0.5 mM) using the EPR oximetry probe LiPc. Line width from the EPR spectra were converted into partial pressure of oxygen using the calibration formula of pO2 = (Line width G − 0.1748)/0.005684. EPR instrument parameters used were microwave frequency 9.775, modulation frequency 100 kHz, modulation amplitude 0.1 G, microwave power 1 mW, number of scans 1, scan time 10.5 s, and time constant 82 ms. The partial pressure of oxygen was converted into dissolved concentration based on the solubility of oxygen in water at room air of 0.265 mM [38].

