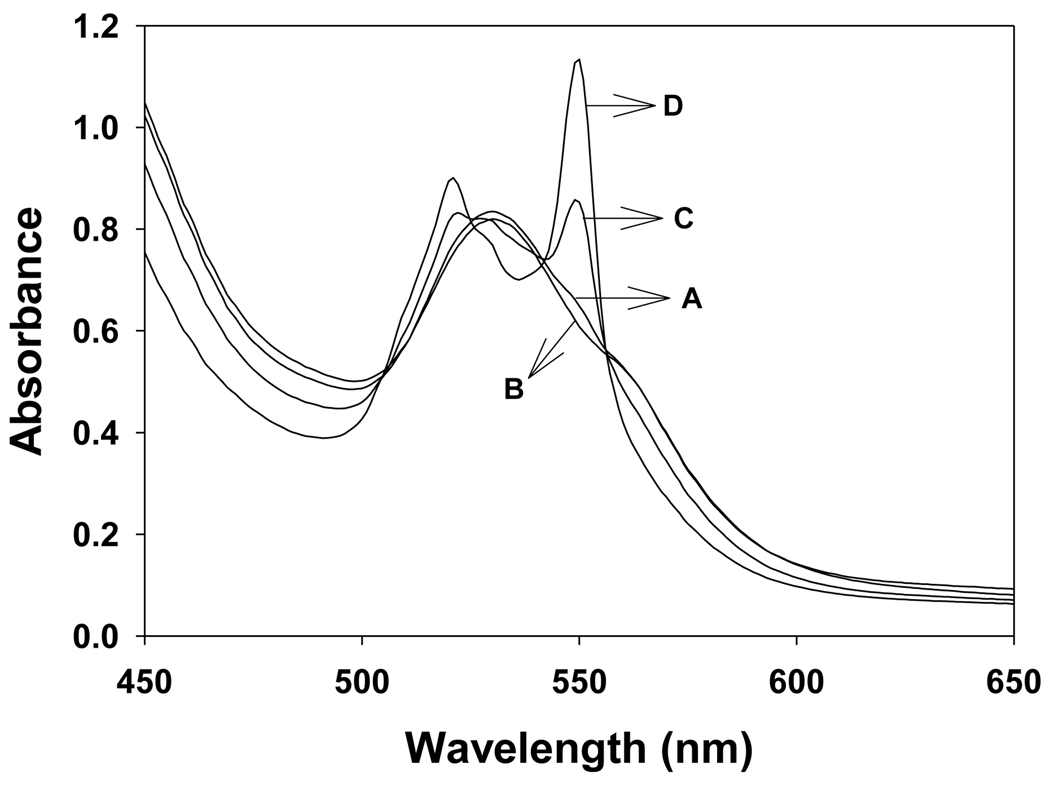
Figure 9.
UV-visible absorption spectra of cyt c in phosphate buffer, pH 7.4. Experiments were performed with Fe3+cyt c, NADH, and H2O2. Reactions were initiated by the addition of H2O2. Spectra were recorded five minutes after mixing all the reactants. A: Fe3+cyt c (0.1 mM), B: Fe3+cyt c (0.1 mM) and H2O2 (0.5 mM), C: Fe3+cyt c (0.1 mM) and NADH (2 mM), D: Fe3+cyt c (0.1 mM), NADH (2 mM), and H2O2 (0.5 mM).

