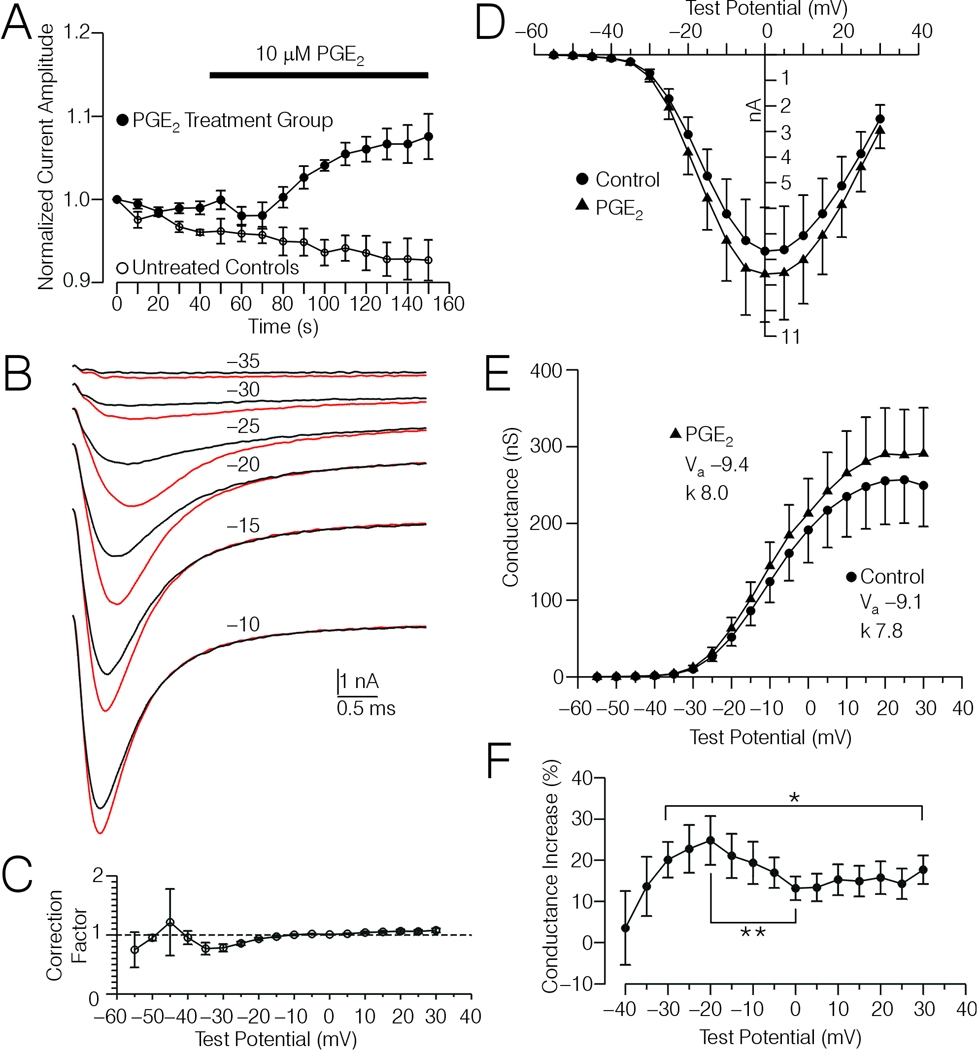
Figure 2.
Effects of PGE2 on Na+ currents in type 4 DRG cells. A, Plot of normalized amplitude of Na+ currents evoked by test potentials (TP) to −10 mV versus time for 7 type-4 DRG cells tested with PGE2 (filled circles), and for 4 untreated control type-4 DRG cells (open circles). The data were normalized relative to the amplitude of the first current in each series shown. The time course of PGE2 treatment (10 µM) is indicated by the horizontal bar. B, Averaged current records acquired from the 7 type-4 DRG cells depicted in (A) evoked by TPs ranging from −35 mV to −10, under control conditions (black traces) and after PGE2 treatment (red traces). C, Correction factors derived from comparisons of current-voltage (I-V) data acquired from the untreated controls depicted in (A) before and after an average of 213 sec (see Experimental Procedures). D, Corrected I-V data acquired from the 7 type-4 DRG cells depicted in (B) before and after PGE2 treatment. The I-V data was extrapolated for the TPs shown from I-V plots where TPs were adjusted for voltage error caused by Rs, and then corrected for spontaneous drift observed in the untreated controls using the average correction factors shown in (C). E, Conductance-voltage (G-V) relationship calculated from the data shown in (D). Insets show the values for Va and k before and after PGE2 treatment, derived by fitting normalized G-V curves (corrected data) with a Boltzmann function as described in Experimental Procedures. The reversal potentials for the 7 DRG cells averaged 40.7 ± 1.3 mV and 40.5 ± 1.2 mV, respectively, before and after PGE2 treatment. F, Plot of the percent increase in conductance versus TP, calculated from the data shown in (D). * Significant change in percent increase in conductance over the range of TPs indicated by the bracket (Friedman-test, p < 0.05). ** Significant decrease in percent increase in conductance at ≈0 mV versus that observed at ≈−20 mV (p < 0.05, Wilcoxon test).

