Figure 5.
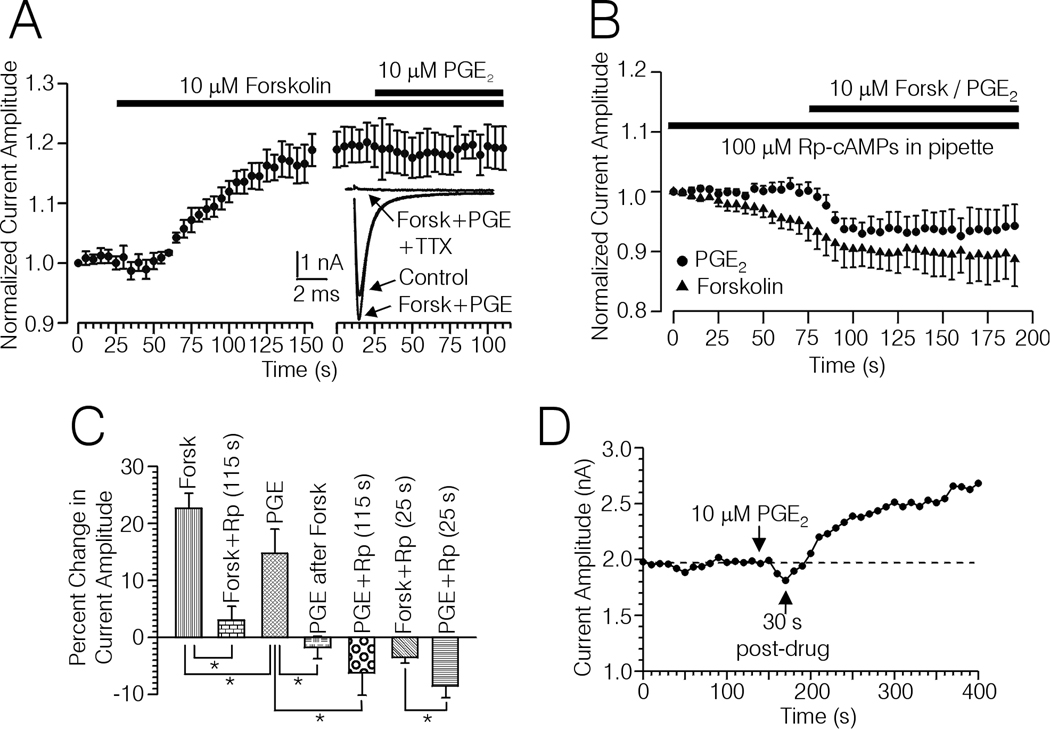
Occlusion of the effects of PGE2 with forskolin, and block by TTX and Rp-cAMPs of the PGE2 and forskolin induced up-regulation of Na+ current. A, Plot of Na+ current amplitude versus time recorded from 5 type-4 DRG cells. The horizontal bars indicate the duration of treatment with forskolin (10 µM), and forskolin + 10 µM PGE2. Inset, Averaged current records acquired from the plot shown in (A) after treatment with forskolin and PGE2, and following treatment with 50 nM TTX in the presence of forskolin and PGE2. B, Plot of Na+ current versus time acquired from type-4 DRG cells recorded from with 100 µM Rp-cAMPs included in the pipette and treated with PGE2 (n = 7, filled circles) or forskolin (n = 10, filled triangles). The horizontal bar indicates the duration of treatment with 10 µM forskolin or PGE2. C, Bargraph summarizing the effects of PGE2 and forskolin on Na+ currents evoked with TPs to −10 mV from type-4 DRG cells under various conditions; in the absence of Rp-cAMPs (PGE, n = 12, Forsk, n = 12), PGE2 following up-regulation of Na+ current with forskolin (PGE after Forsk, n = 5), in the presence of Rp-cAMPs after an average of ≈ 25 sec following initiation of drug treatment (PGE + Rp (25 s), n = 7), (Forsk + Rp (25s), n = 10), and at the end of the plot (PGE + Rp (115 s), n = 7), Forsk + Rp (115 s), n = 10. * significant difference between the means indicated by each bracket, (p < 0.05, Mann Whitney U-test). In cases where a mean is compared multiple times the α-level has been adjusted using the Bonferroni adjustment for multiple comparisons. D, Example of a biphasic response of a type-4 DRG cell regarding PGE2 induced changes in the amplitude of Na+ current evoked with TPs to −10 mV in the absence of Rp-cAMPs.

