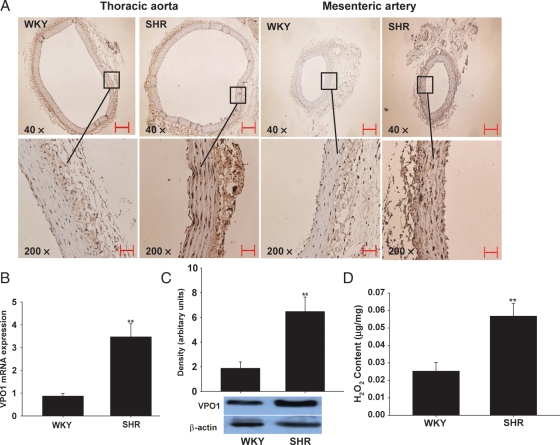
Figure 1.
Expression of VPO1 and content of H2O2 in arterial tissues in rats. (A) The immunohistochemistry analysis of VPO1 expression in thoracic aorta and mesenteric artery from SHRs and WKY rats. Scale bar represents 50 µm. (B) The mRNA expression of VPO1 in thoracic aorta by real-time PCR analysis. (C) The protein expression of VPO1 in thoracic aorta by western blot analysis. (D) The H2O2 content in thoracic aorta. SHRs, spontaneously hypertensive rats; WKY, Wistar–Kyoto rats. n = 10; **P< 0.01 vs. SHR.

