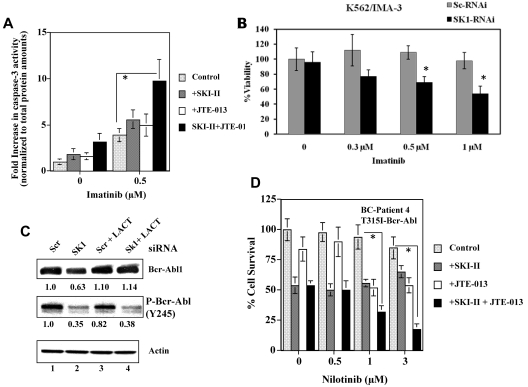
Figure 6.
Effects of the inhibition of SK-1 and S1P2 on imatinib- or nilotinib-induced apoptosis in K562/IMA-3 and MNCs obtained from a CML patient at BC with the T315I-Bcr-Abl1 expression. (A) Imatinib-induced apoptosis (at 0.5μM for 24 hours) in the absence/presence of SKI-II, JTE-013 or SKI-II/JTE-013 in combination was measured using the caspase 3 activity assay in K562/IMA-3 cells. (B) Effects of knockdown of SK-1 using siRNA on the inhibition of survival in response to imatinib treatment (at 0.3, 0.5, and 1.0μM at 48 hours) in K562/IMA-3 cells were determined using trypan blue exclusion. (C) Effects of knockdown of SK-1 using siRNA on total and P-Bcr-Abl1 expression in the absence/presence of LACT (5 μM) in K562/IMA-3 cells were assessed by Western blotting compared with Scr siRNA treated controls (top and middle panels lanes 2-4 and 1-3, respectively). Actin levels were used as loading controls (bottom panel). Relative expression levels of Bcr-Abl1 and P-Bcr-Abl1 (normalized to actin levels) are shown below each lane. (D) Effects of the inhibition of SK-1 and S1P2 using SKI-II and JTE-013, respectively, alone or in combination, on the survival of MNCs isolated from a CML patient at BC (patient 4), who expressed the T315I-Bcr-Abl1 who did not respond to any treatment in the clinic, were determined using 3-(4,5-dimethylthiazol-2-yl)-2,5-dimethyltetrazolium bromide; 3-[4,5-dimethylthiazol-2-yl]-2,5-diphenyltetrazolium bromide assay in the absence/presence of nilotinib (0.5, 1.0, or 3.0μM for 48 hours). The data represent at least 2 independent trials performed in duplicates, and error bars represent SD. *P < .05 was considered significant.

