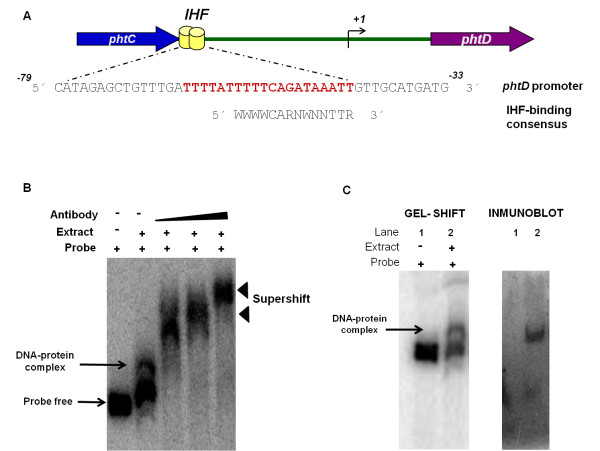
Figure 3.
Bioinformatic analysis of the sequence upstream of the phtD operon, and Supershift and Shift-western experiments to analyze the DNABII-family proteins binding activity to the PphtD fragment. (A) Bioinformatic analyses. This panel schematizes the intergenic region between phtC and phtD where the IHF binding site position is represented with a yellow barrel. The alignment of the phtD IHF binding site with the consensus IHF binding site proposed by Kur et al [27] is also shown. The sequence identified as the putative IHF binding site in the phtD promoter is shown in bold red letters. W: A or T; R: A or G; N, any base. (B) Supershift assays. Analyses were conducted using increasing concentrations of anti DNAB-II family proteins antibody. Supershift signals were observed when antibody was added to the reaction mixture. The specific DNA-protein complex is indicated by a solid arrow. Supershift bands are indicated by solid arrowheads. (C) Shift-western experiment. Gel shift assays with the PphtD probe were performed as described in the Methods, followed by transfer of proteins onto nitrocellulose membranes, which were probed with antibody to DNA-binding proteins of DNAB-II family. To identify the signal, the images were analyzed using Quantity-one software (BIO-RAD) following the manufacturer's instructions. Panel I depicts a standard gel mobility assay with radiolabeled PphtD probe. Lane 1, free probe; lane 2, DNA-protein complex. Panel II: Immunoblot using polyclonal antibody. Lanes correspond to those of Panel I. The arrow indicates the position of the gel shift band.

