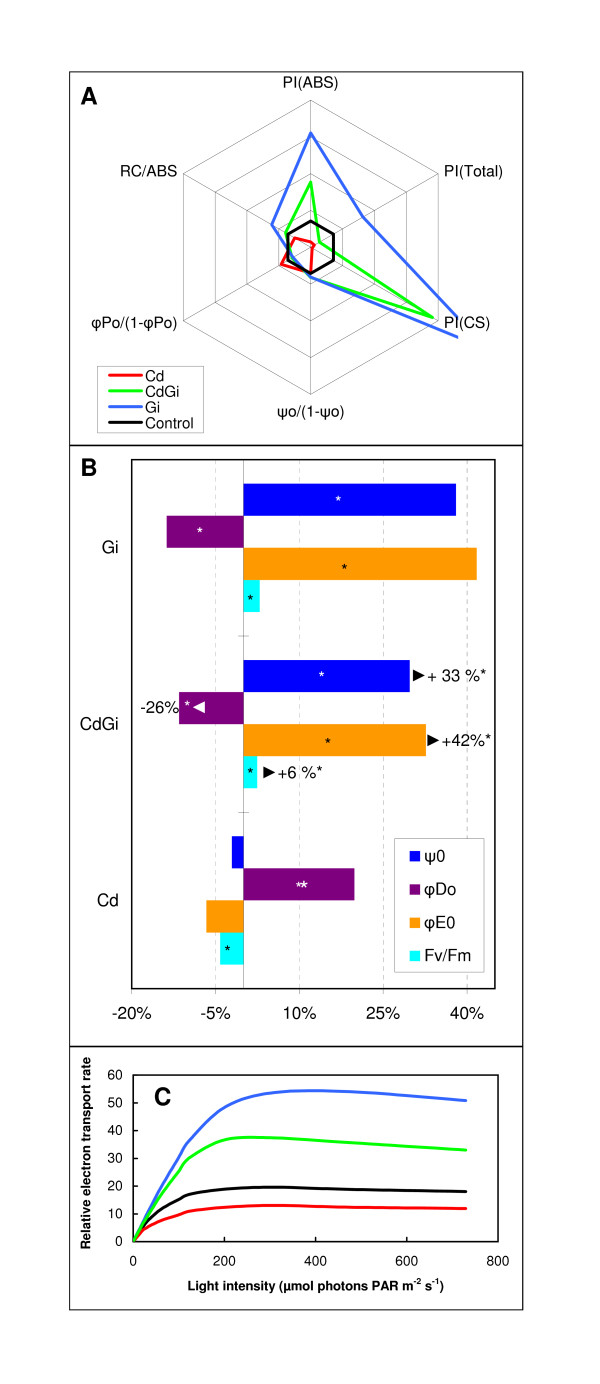
Figure 4.
Influence of cadmium (Cd) and/or G. irregulare inoculation (Gi) on the parameters of the OJIP-test and relative electron transport rate. (A), Variations of performance indices and structural OJIP-test parameters plotted (spiderplot center = 0.5, maximum = 4) relative to their respective control (set as reference ticked line = 1). (B), Deviation of the fluxes as expressed relative to non-treated plants. Asterisks indicate significant difference at p < 0.05. The values indicated by arrows, expressed in percents, reflect the deviation flux differences between Cd-treated mycorrhizal plants and those only Cd-treated. Asterisks indicate significant difference at p < 0.05. Data relative to panels A and B represent an average of 5 to 6 independent measurements. The corresponding statistical data (n ≥ 5) are provided in additional file 2. (C), Plot of relative of relative linear electron transport rate (ETR) as a function of quantum flux density of the photosynthetically active radiation (PAR). The ETR was measured via the fluorescence parameter (as described in Methods) in attached leaves. Data represent an average of six plant replicates. The colour legend of panel C is the same as for panel A. Statistical data (n = 6) are provided in additional file 2 for the maximum apparent ETR (ETRMAX).

