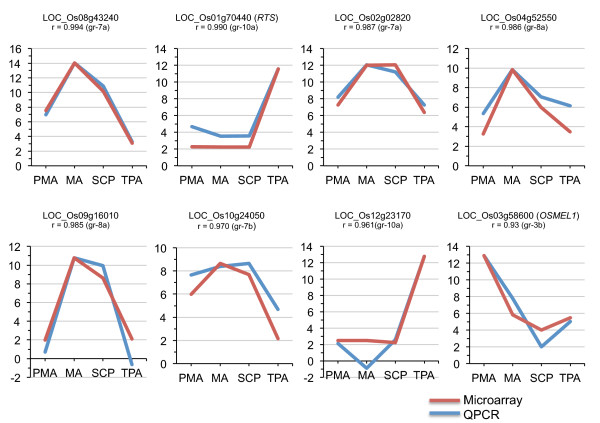
Figure 4.
Q-PCR analysis of eight genes showing anther developmental stage-specific expression and its correlation with microarray data. Three biological replicates were taken for both Q-PCR and microarray analysis. The Y axis represents normalized log2 transformed expression values obtained using microarray analysis and log2 transformed relative transcript amount obtained by Q-PCR. The Q-PCR data has been scaled such that the maximum expression value of Q-PCR equals that of the maximum value of the microarray to ease profile matching. Gene locus IDs and their affiliation to the co-expression groups shown in Figure 3 are mentioned. The correlation co-efficient (r) between the two expression profiles is also indicated. Expression of 18S rRNA was used as an internal control to normalize the Q-PCR data. PMA; pre-meiotic anthers, MA; meiotic anthers, SCP; anthers with single-celled pollen, TPA; tri-nucleate pollen containing anthers.

