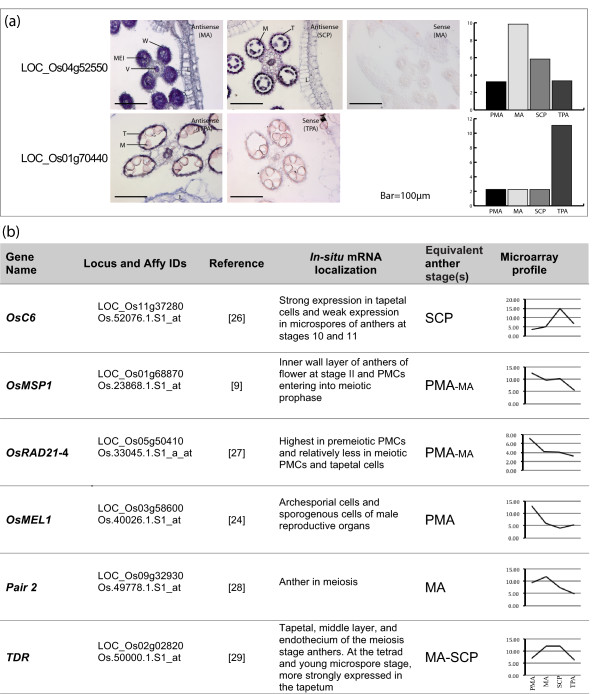
Figure 5.
Validation of microarray data by in-situ hybridization. (a) In-situ localization of transcripts corresponding to the genes LOC_Os04g52550 and LOC_Os01g70440 in rice florets (MA, SCP and TPA stages as marked). Corresponding microarray-based expression profiles of these two genes are also shown as bar graphs for comparison. W, wall layers; V, vascular tissue; T, tapetum; M, microspores; MEI, meiocytes; L, lemma. (b) A compilation of in-situ localization analyses for six genes using published literature and their correlation with anther preferential expression profiles as revealed by the microarray analysis described in this paper. The log2 normalized expression values were used to represent the gene specific microarray profiles.

