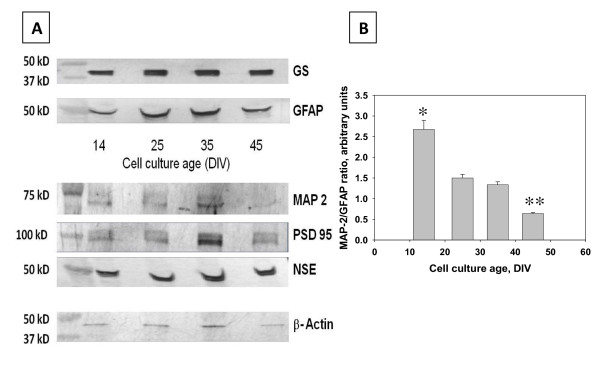
Figure 3.
MAP-2 and GFAP expression changes over time. A. A comparison of Western blots of specific cell proteins and ubiquitous proteins in both astrocytes and neurons. There is a steady expression of both GS and GFAP throughout the life of the culture, indicating that astrocytes do not over take the dish. MAP-2 and PSD 95 expression increases until DIV 35, at DIV 45 there is a marked drop in the expression of these proteins. This may be due to the fragmentation of neurites. The steady expression of NSE indicates a steady cell population. The steady expression of β-actin indicates that the cell population remains unchanged throughout the life cycle of the cell. B. The ratio between MAP-2 and GFAP decreases over time, supporting the western blots for MAP-2 and GFAP. At later time points, although there is an unchanged presence of GFAP, there is a decreased expression of MAP-2.

